

Question: (4 points) Consider the following equations to explain the annual salaries for chief executive officers (CEOs) in four different industries; financial, consumer products, energy (gas,
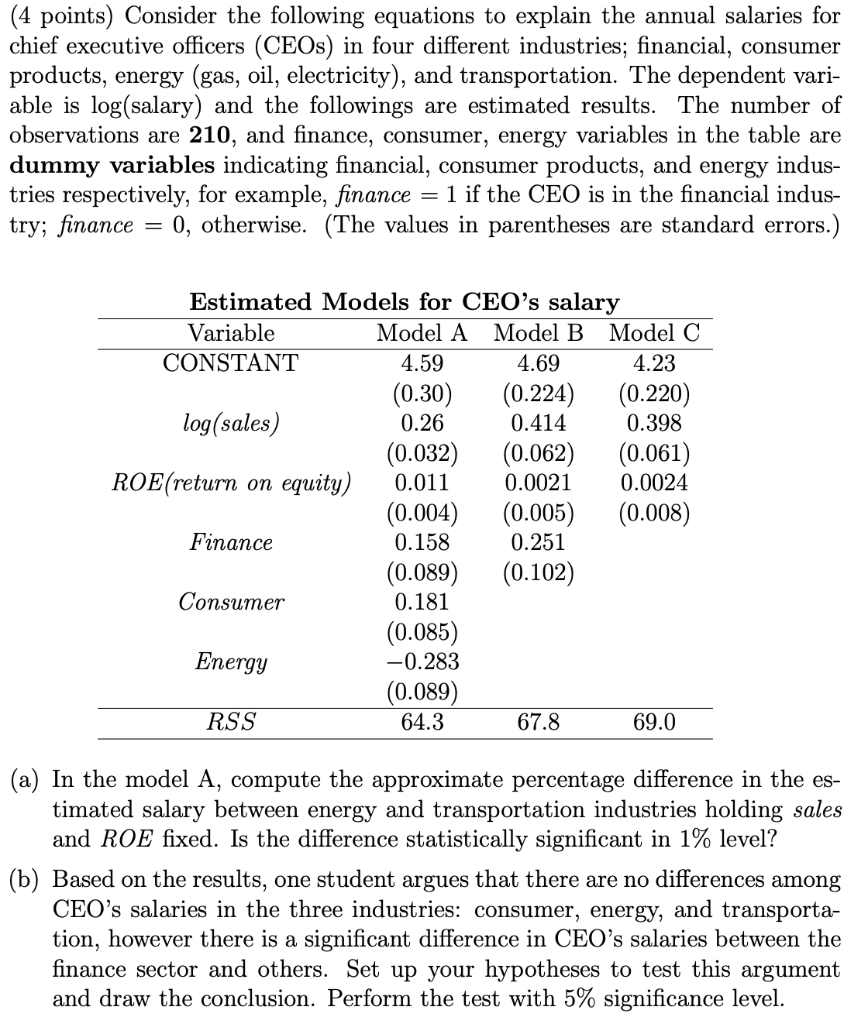
(4 points) Consider the following equations to explain the annual salaries for chief executive officers (CEOs) in four different industries; financial, consumer products, energy (gas, oil, electricity), and transportation. The dependent vari- able is log(salary) and the followings are estimated results. The number of observations are 210, and finance, consumer, energy variables in the table are dummy variables indicating financial, consumer products, and energy indus- tries respectively, for example, finance = 1 if the CEO is in the financial indus- try; finance 0, otherwise. (The values in parentheses are standard errors.) Estimated Models for CEO's salary Variable Model A Model B Model C CONSTANT 4.59 4.69 4.23 (0.30) (0.224) (0.220) log(sales) 0.26 0.414 0.398 (0.032) (0.062) (0.061) ROE(return on equity) 0.011 0.0021 0.0024 (0.004) (0.005) (0.008) Finance 0.158 0.251 (0.089) (0.102) Consumer 0.181 (0.085) Energy -0.283 (0.089) RSS 64.3 67.8 69.0 (a) In the model A, compute the approximate percentage difference in the es- timated salary between energy and transportation industries holding sales and ROE fixed. Is the difference statistically significant in 1% level? (b) Based on the results, one student argues that there are no differences among CEO's salaries in the three industries: consumer, energy, and transporta- tion, however there is a significant difference in CEO's salaries between the finance sector and others. Set up your hypotheses to test this argument and draw the conclusion. Perform the test with 5% significance level. (4 points) Consider the following equations to explain the annual salaries for chief executive officers (CEOs) in four different industries; financial, consumer products, energy (gas, oil, electricity), and transportation. The dependent vari- able is log(salary) and the followings are estimated results. The number of observations are 210, and finance, consumer, energy variables in the table are dummy variables indicating financial, consumer products, and energy indus- tries respectively, for example, finance = 1 if the CEO is in the financial indus- try; finance 0, otherwise. (The values in parentheses are standard errors.) Estimated Models for CEO's salary Variable Model A Model B Model C CONSTANT 4.59 4.69 4.23 (0.30) (0.224) (0.220) log(sales) 0.26 0.414 0.398 (0.032) (0.062) (0.061) ROE(return on equity) 0.011 0.0021 0.0024 (0.004) (0.005) (0.008) Finance 0.158 0.251 (0.089) (0.102) Consumer 0.181 (0.085) Energy -0.283 (0.089) RSS 64.3 67.8 69.0 (a) In the model A, compute the approximate percentage difference in the es- timated salary between energy and transportation industries holding sales and ROE fixed. Is the difference statistically significant in 1% level? (b) Based on the results, one student argues that there are no differences among CEO's salaries in the three industries: consumer, energy, and transporta- tion, however there is a significant difference in CEO's salaries between the finance sector and others. Set up your hypotheses to test this argument and draw the conclusion. Perform the test with 5% significance level
Step by Step Solution
There are 3 Steps involved in it

Get step-by-step solutions from verified subject matter experts