

Question: 4 points variable1 variable2 Scatter plots are used to discover relationships between variables. Using the 3 8.78162 18.34055 corresponding measurements of variable1 and variable2 in
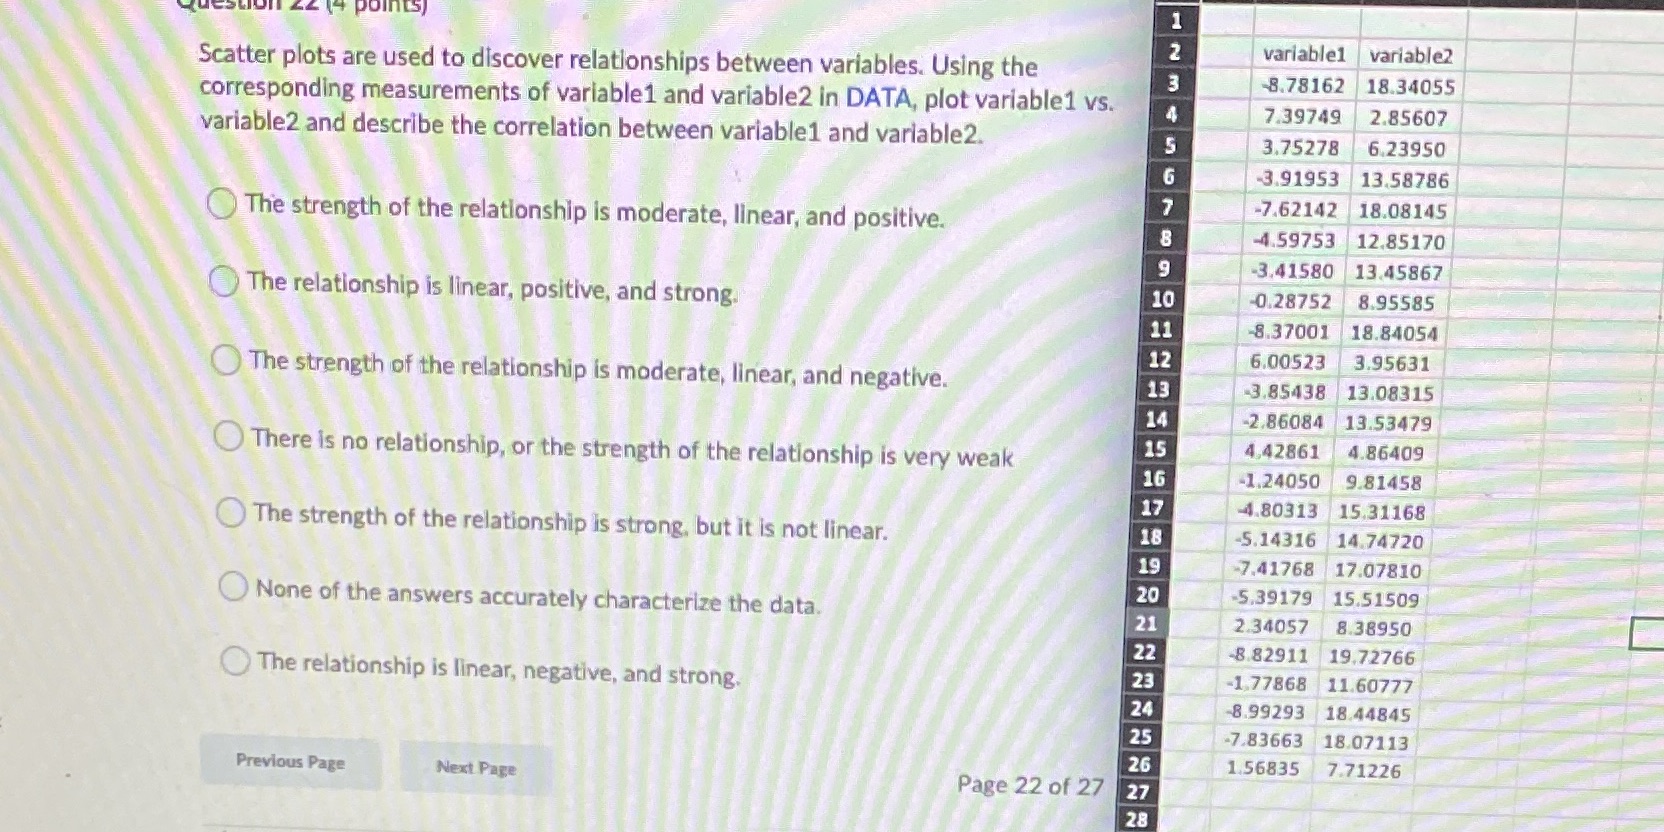

4 points variable1 variable2 Scatter plots are used to discover relationships between variables. Using the 3 8.78162 18.34055 corresponding measurements of variable1 and variable2 in DATA, plot variable1 vs. 7.39749 2.85607 variable2 and describe the correlation between variable1 and variable2. 3.75278 6.23950 G -3.91953 13.58786 -7.62142 18.08145 The strength of the relationship is moderate, linear, and positive. B 4.59753 12.85170 9 -3.41580 13.45867 The relationship is linear, positive, and strong. 10 0.28752 8.95585 11 8.37001 18.84054 12 6.00523 3.95631 The strength of the relationship is moderate, linear, and negative. 13 3.85438 13.08315 14 -2,86084 13.53479 O There is no relationship, or the strength of the relationship is very weak 15 4,42861 4.86409 16 -1.24050 9.81458 17 4.80313 15.31168 The strength of the relationship is strong, but it is not linear. 18 -5.14316 14.74720 19 7.41768 17.07810 20 -5.39179 15.51509 ONone of the answers accurately characterize the data. 21 2.34057 8.38950 22 8.82911 19.72766 The relationship is linear, negative, and strong. -1, 77868 11.60777 24 8.99293 18.44845 -7.83663 18.07113 26 1.56835 7.71226 Previous Page Next Page Page 22 of 27 27 28
Step by Step Solution
There are 3 Steps involved in it

Get step-by-step solutions from verified subject matter experts