

Question: #4 positive, uncorreated, and pertectly nogative. The expected return and ribk values calculated for each of the assets are shown in the following table. a.
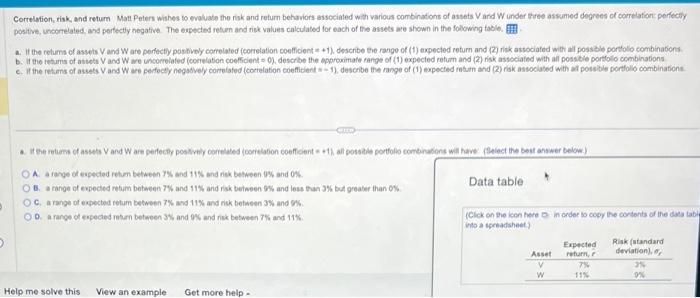

positive, uncorreated, and pertectly nogative. The expected return and ribk values calculated for each of the assets are shown in the following table. a. If the return of assets Vand W are perfecty postivey carreleted foorelation coefficient = +1), describe eve rango of (1) expected return and (2) risk atsociated with al possible portolo combinabons c. If the retarn of assets V and W are perfocly negatvely contelafed (corielation coeflicient = - 1), descrbe the range of (1) eopected ratarn and (2) riak associated with ar possible porffolo combinations. positive, uncorrelated, and perectly negative. The expected return and risk values calculated for each of the assots are shown in the following table. A. a range of expected return beteven 6% and 12% and ritk between 6% and 11% : D. a rache of espected retum between $ and 11% and risk behween 6% and 12% Data table C. s range of expected retum between 9% and 11% and risk between 12% and less than 6% but greater ban 0%. D. A range of expected retum between 9% and 11% and risk between 12% and 0% (Cicke on the icon Rere on in order to copy the contents of thie itata tay inth a sprestsheet.). \begin{tabular}{ccc} Asset & Expected & Risk (standard \\ return & deviationt f \\ \hline W & 9% & 64 \\ \hline \end{tabular}
Step by Step Solution
There are 3 Steps involved in it

Get step-by-step solutions from verified subject matter experts