

Question: 4 Previous Problem Problem List Next Problem (1 point) Below is partial Minitab output from a multiple regression: multicolumn2|c|Regression Statistics Multiple R 0.3846 R Square
4
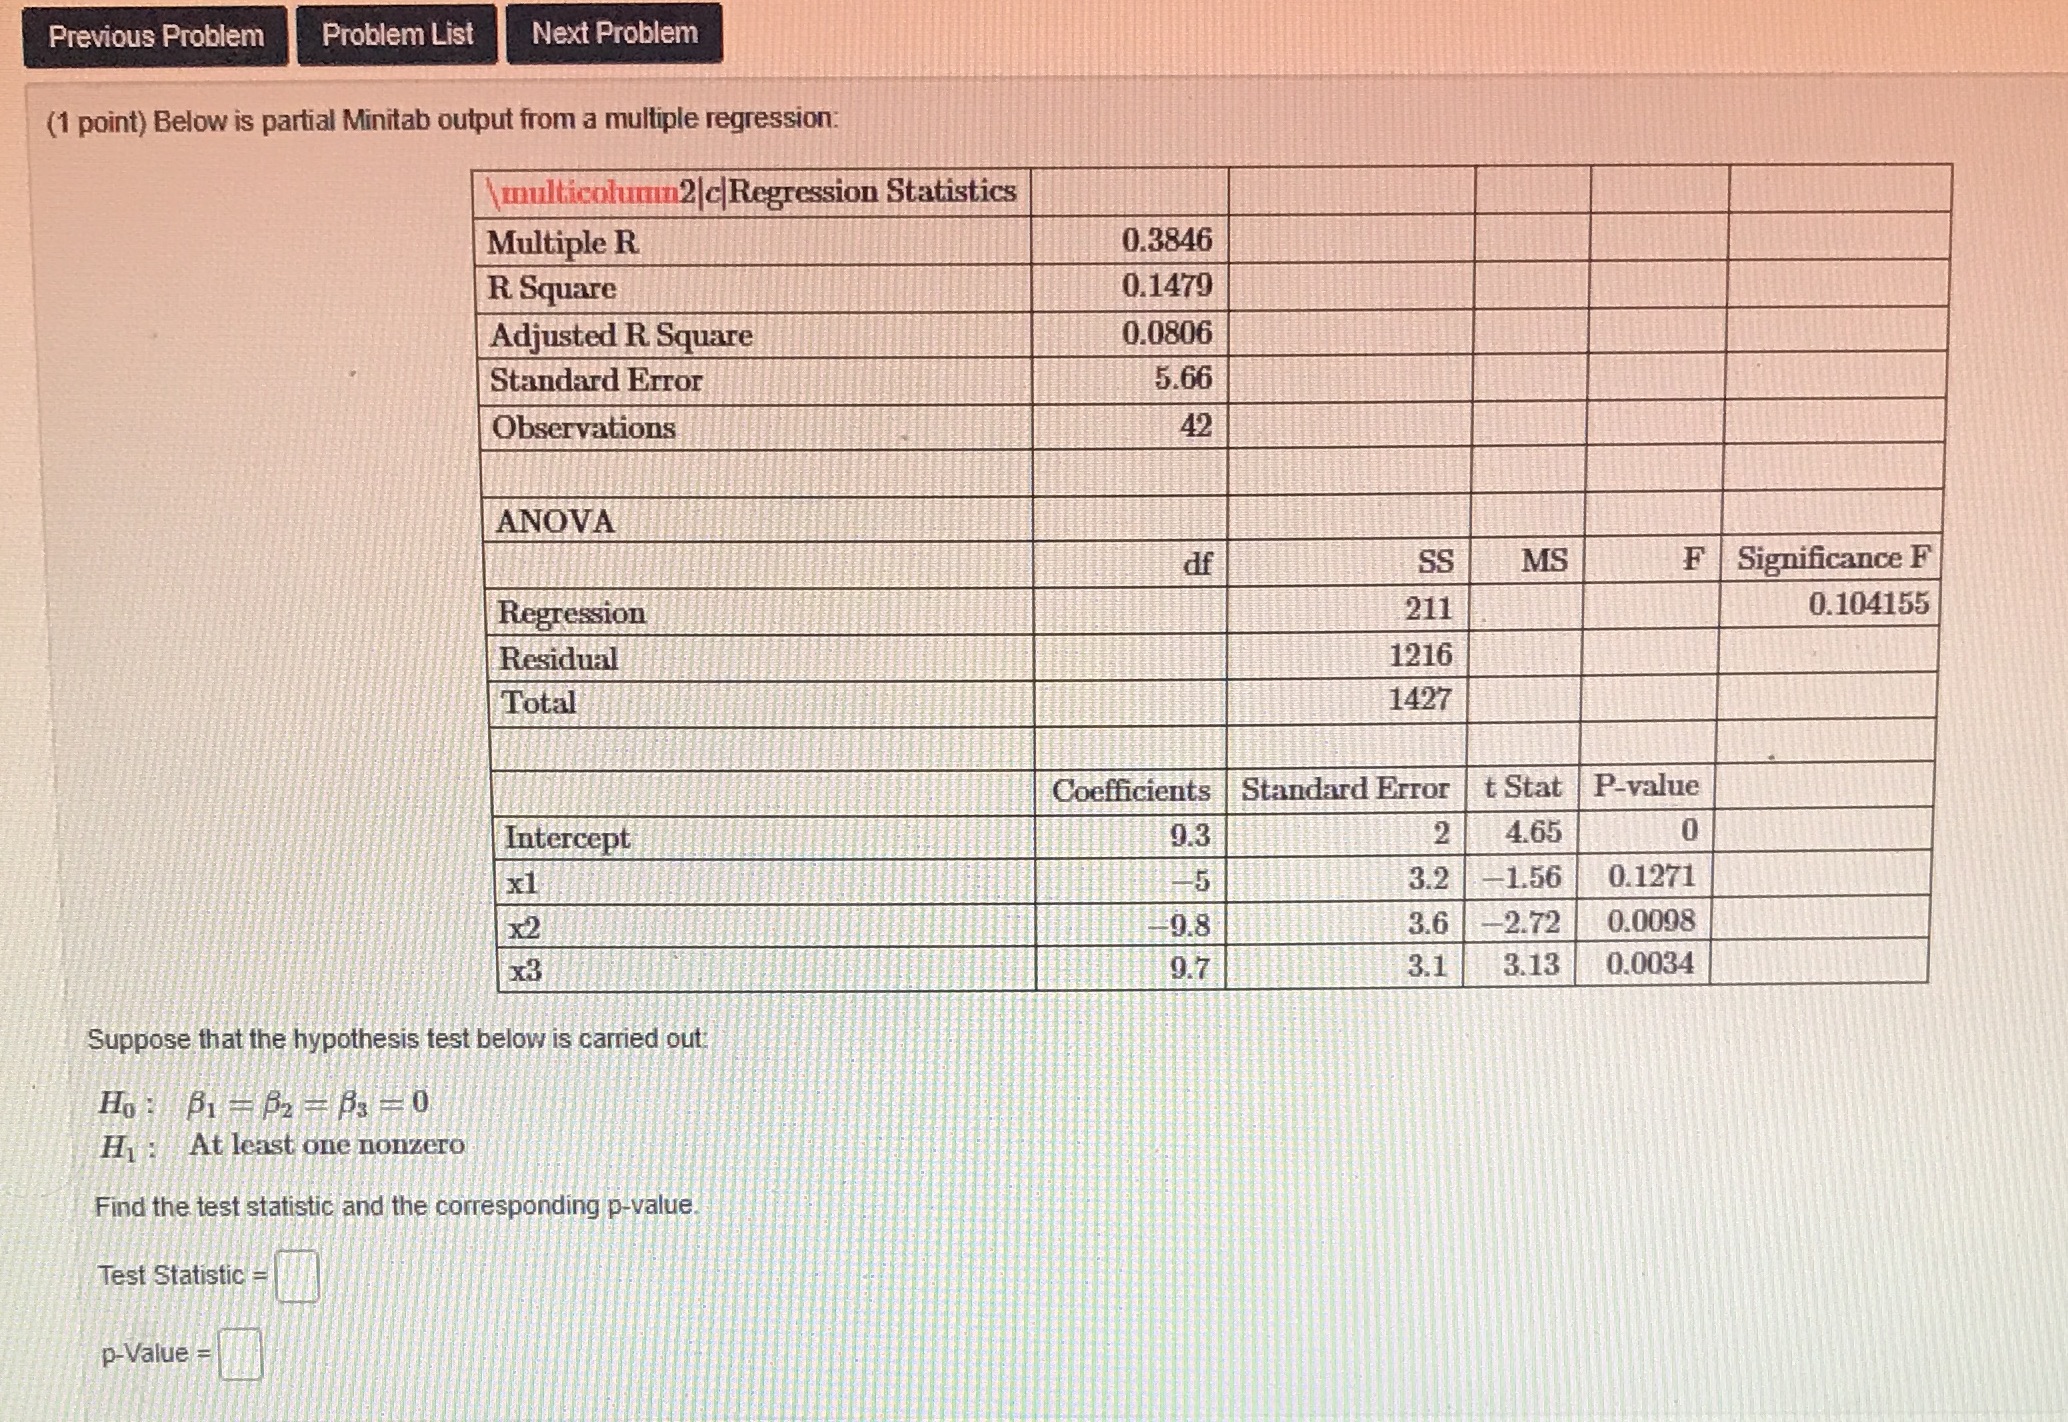
Previous Problem Problem List Next Problem (1 point) Below is partial Minitab output from a multiple regression: multicolumn2|c|Regression Statistics Multiple R 0.3846 R Square 0.1479 Adjusted R Square 0.0806 Standard Error 5.66 Observations 42 ANOVA df SS MS F Significance F Regression 211 0.104155 Residual 1216 Total 1427 Coefficients|Standard Error t Stat P-value Intercept 9.3 12 4.65 0 x1 15 3.2 -1.56 0.1271 X2 -9.8 3.6 -2.72 0.0098 x3 9.7 3.1 3.13 0.0034 Suppose that the hypothesis test below is carried out Ho: B1 = P2 = P3 =0 H : At least one nonzero Find the test statistic and the corresponding p-value. Test Statistic - p-Value
Step by Step Solution
There are 3 Steps involved in it

Get step-by-step solutions from verified subject matter experts