

Question: 4. Problem 4 (6 Points) The following data show the number of candles sold in January, February, and March in 2022 at Kroget: a. Using
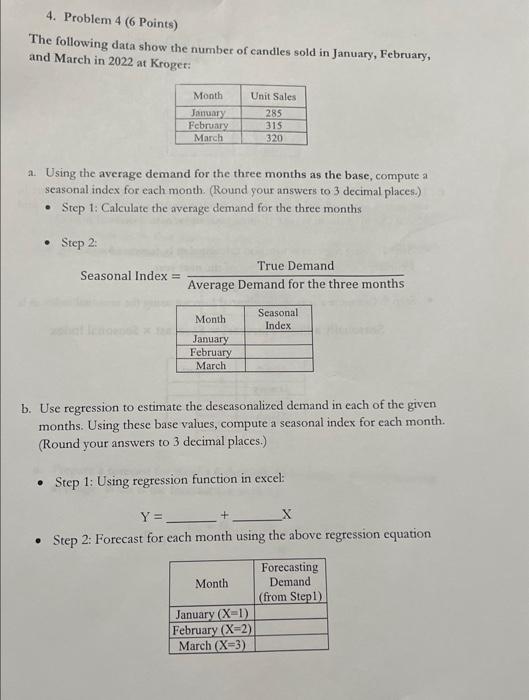
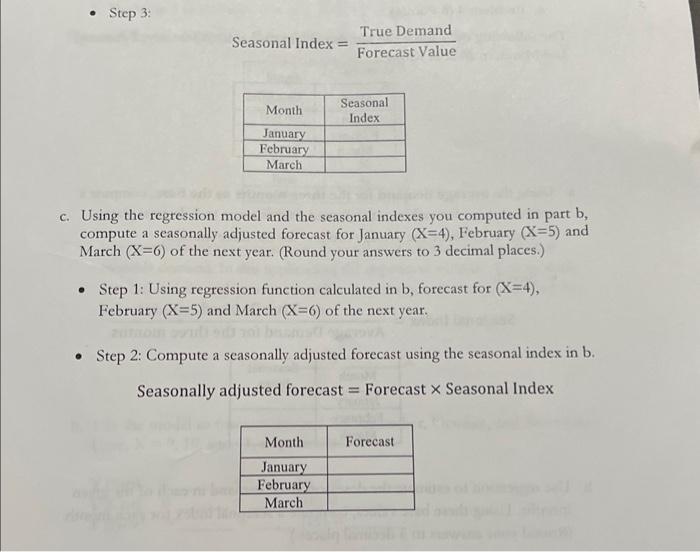
4. Problem 4 (6 Points) The following data show the number of candles sold in January, February, and March in 2022 at Kroget: a. Using the average demand for the three months as the base, compute a seasonal index for each month. (Round your answers to 3 decimal places.) - Step 1: Calculate the average demand for the three months - Step 2: SeasonalIndex=AverageDemandforthethreemonthsTrueDemand b. Use regression to estimate the deseasonalized demand in each of the given months. Using these base values, compute a seasonal index for each month. (Round your answers to 3 decimal places.) - Step 1: Using regression function in excel: Y= + - Step 2: Forecast for each month using the above regression equation SeasonalIndex=ForecastValueTrueDemand c. Using the regression model and the seasonal indexes you computed in part b, compute a seasonally adjusted forecast for January (X=4), February (X=5) and March (X=6) of the next year. (Round your answers to 3 decimal places.) - Step 1: Using regression function calculated in b, forecast for (X=4), February (X=5) and March (X=6) of the next year. - Step 2: Compute a seasonally adjusted forecast using the seasonal index in b. Seasonally adjusted forecast = Forecast Seasonal Index
Step by Step Solution
There are 3 Steps involved in it

Get step-by-step solutions from verified subject matter experts