

Question: 4 Problem 4-4 7 points Table 3.1 presents R&E Supplies' financial statements for the period 2014 through 2017, and Table 3.5 presents a pro forma
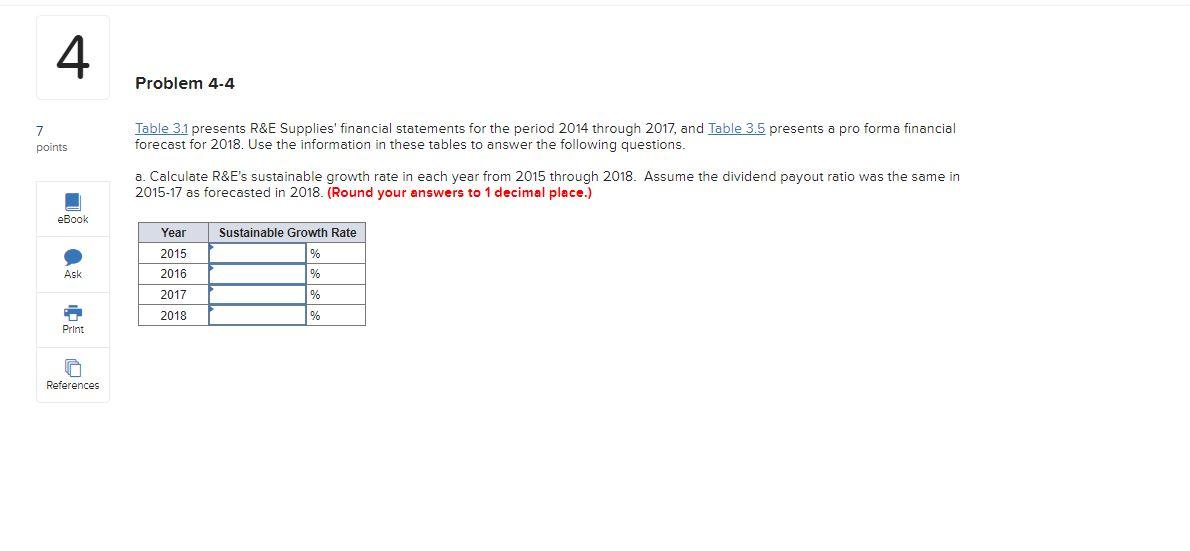
4 Problem 4-4 7 points Table 3.1 presents R&E Supplies' financial statements for the period 2014 through 2017, and Table 3.5 presents a pro forma financial forecast for 2018. Use the information in these tables to answer the following questions. a. Calculate R&E's sustainable growth rate in each year from 2015 through 2018. Assume the dividend payout ratio was the same in 2015-17 as forecasted in 2018. (Round your answers to 1 decimal place.) eBook Sustainable Growth Rate Ask Year 2015 2016 2017 2018 % % % Print References 4 Problem 4-4 7 points Table 3.1 presents R&E Supplies' financial statements for the period 2014 through 2017, and Table 3.5 presents a pro forma financial forecast for 2018. Use the information in these tables to answer the following questions. a. Calculate R&E's sustainable growth rate in each year from 2015 through 2018. Assume the dividend payout ratio was the same in 2015-17 as forecasted in 2018. (Round your answers to 1 decimal place.) eBook Sustainable Growth Rate Ask Year 2015 2016 2017 2018 % % % Print References
Step by Step Solution
There are 3 Steps involved in it

Get step-by-step solutions from verified subject matter experts