

Question: 4. Provide Trend analysis for the last 5 years for TESLA and determine 1-year projections for the key performance metrics below. (Include justifications for

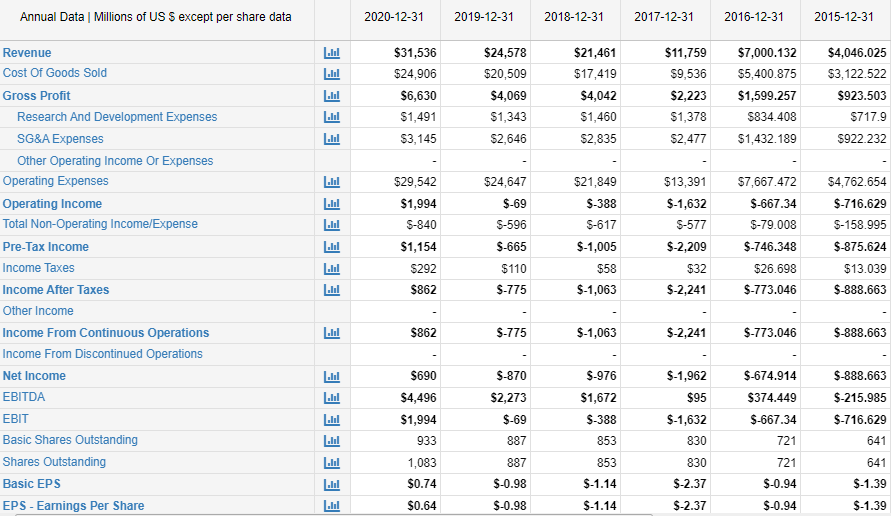
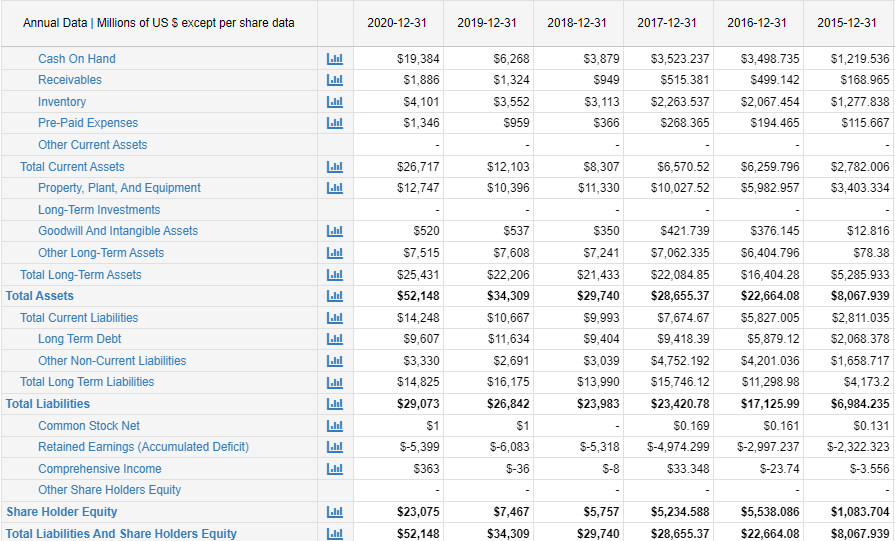
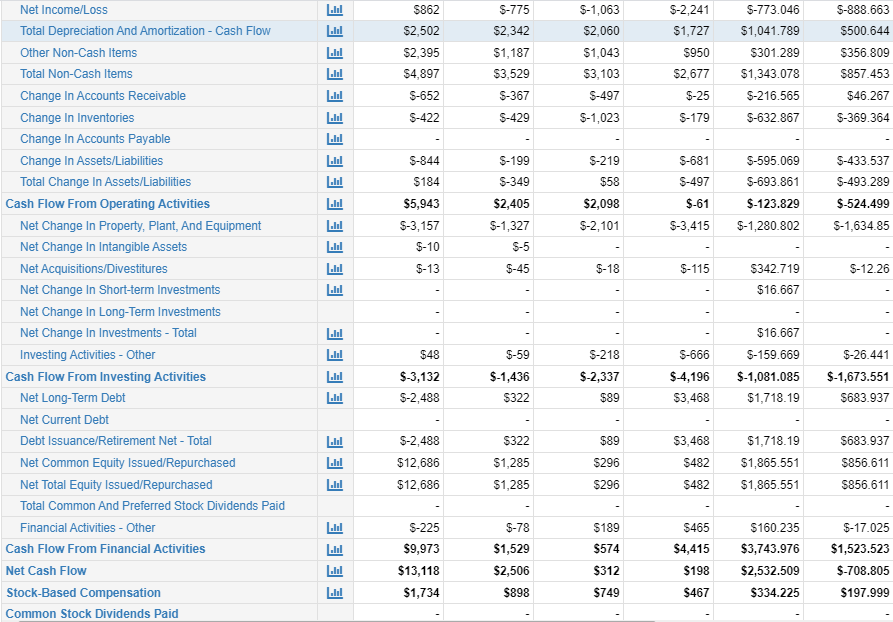
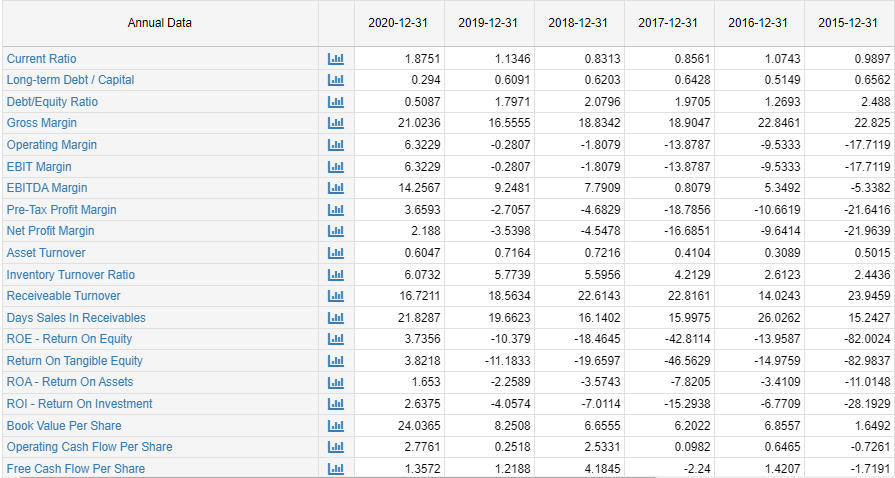
4. Provide Trend analysis for the last 5 years for TESLA and determine 1-year projections for the key performance metrics below. (Include justifications for your projections). Turnover ratios Return on Equity P/E Ratio Cash Conversion Cycle Revenue/Sales Growth Net Income Growth Debt to Assets Working Capital Annual Data | Millions of US $ except per share data Revenue Cost Of Goods Sold Gross Profit Research And Development Expenses SG&A Expenses Other Operating Income Or Expenses Operating Expenses Operating Income Total Non-Operating Income/Expense Pre-Tax Income Income Taxes Income After Taxes Other Income Income From Continuous Operations Income From Discontinued Operations Net Income EBITDA EBIT Basic Shares Outstanding Shares Outstanding Basic EPS EPS - Earnings Per Share EEEEE EE .... .... EE L.H 3 L.H EE L. Lul 3 ... 2020-12-31 $31,536 $24,906 $6,630 $1,491 $3,145 $29,542 $1,994 $-840 $1,154 $292 $862 $862 $690 $4,496 $1,994 933 1,083 $0.74 $0.64 2019-12-31 $24,578 $20,509 $4,069 $1,343 $2,646 $24,647 $-69 $-596 $-665 $110 $-775 $-775 $-870 $2,273 $-69 887 887 $-0.98 $-0.98 2018-12-31 $21,461 $17,419 $4,042 $1,460 $2,835 $21,849 $-388 $-617 $-1,005 $58 $-1,063 $-1,063 $-976 $1,672 $-388 853 853 $-1.14 $-1.14 2017-12-31 $11,759 $7,000.132 $9,536 $5,400.875 $2,223 $1,599.257 $1,378 $834.408 $2,477 $1,432.189 $13,391 $7,667.472 $-1,632 $-667.34 $-577 $-79.008 $-2,209 $-746.348 $26.698 $-773.046 $32 $-2,241 2016-12-31 $-2,241 $-1,962 $95 $-1,632 830 830 $-2.37 $-2.37 $-773.046 $-674.914 $374.449 $-667.34 721 721 $-0.94 $-0.94 2015-12-31 $4,046.025 $3,122.522 $923.503 $717.9 $922.232 $4,762.654 $-716.629 $-158.995 $-875.624 $13.039 $-888.663 $-888.663 $-888.663 $-215.985 $-716.629 641 641 $-1.39 $-1.39 Annual Data | Millions of US $ except per share data Cash On Hand Receivables Inventory Pre-Paid Expenses Other Current Assets Total Current Assets Property, Plant, And Equipment Long-Term Investments Goodwill And Intangible Assets Other Long-Term Assets Total Long-Term Assets Total Assets Total Current Liabilities Long Term Debt Other Non-Current Liabilities Total Long Term Liabilities Total Liabilities Common Stock Net Retained Earnings (Accumulated Deficit) Comprehensive Income Other Share Holders Equity Share Holder Equity Total Liabilities And Share Holders Equity 3 L.H .... EE EE EE Lh L.H .... hl EEEE 3 ... 2020-12-31 $19,384 $1,886 $4,101 $1,346 $26,717 $12,747 $520 $7,515 $25,431 $52,148 $14,248 $9,607 $3,330 $14,825 $29,073 $1 $-5,399 $363 $23,075 $52,148 2019-12-31 $6,268 $1,324 $3,552 $959 $12,103 $10,396 $537 $7,608 $22,206 $34,309 $10,667 $11,634 $2,691 $16,175 $26,842 $1 $-6,083 $-36 $7,467 $34,309 2018-12-31 2017-12-31 $3,879 $3,523.237 $3,498.735 $949 $515.381 $499.142 $3,113 $2,263.537 $2,067.454 $366 $268.365 $194.465 $8,307 $11,330 $10,027.52 2016-12-31 $-5,318 $-8 $350 $421.739 $376.145 $7,241 $7,062.335 $6,404.796 $21,433 $22,084.85 $16,404.28 $29,740 $28,655.37 $22,664.08 $9,993 $7,674.67 $9,404 $9,418.39 $3,039 $13,990 $15,746.12 $23,983 $23,420.78 $0.169 $-4,974.299 $33.348 $6,570.52 $6,259.796 $2,782.006 $5,982.957 $3,403.334 $5,827.005 $5,879.12 $4,752.192 $4,201.036 $11,298.98 $17,125.99 $0.161 $-2,997.237 S-23.74 2015-12-31 $5,757 $5,234.588 $5,538.086 $29,740 $28,655.37 $22,664.08 $1,219.536 $168.965 $1,277.838 $115.667 $12.816 $78.38 $5,285.933 $8,067.939 $2,811.035 $2,068.378 $1,658.717 $4,173.2 $6,984.235 $0.131 $-2,322.323 $-3.556 $1,083.704 $8,067.939 Net Income/Loss Total Depreciation And Amortization - Cash Flow Other Non-Cash Items Total Non-Cash Items Change In Accounts Receivable Change In Inventories Change In Accounts Payable Change In Assets/Liabilities Total Change In Assets/Liabilities Cash Flow From Operating Activities Net Change In Property, Plant, And Equipment Net Change In Intangible Assets Net Acquisitions/Divestitures Net Change In Short-term Investments Net Change In Long-Term Investments Net Change In Investments - Total Investing Activities - Other Cash Flow From Investing Activities Net Long-Term Debt Net Current Debt Debt Issuance/Retirement Net - Total Net Common Equity Issued/Repurchased Net Total Equity Issued/Repurchased Total Common And Preferred Stock Dividends Paid Financial Activities - Other Cash Flow From Financial Activities Net Cash Flow Stock-Based Compensation Common Stock Dividends Paid 1.M L.H l L.H .... L.H LAI hl .... .... Lul L 3 Lul .... EEEE EEE EEEE $862 $2,502 $2,395 $4,897 $-652 $-422 $-844 $184 $5,943 $-3,157 $-10 $-13 $48 $-3,132 $-2,488 $-2,488 $12,686 $12,686 $-225 $9,973 $13,118 $1,734 $-775 $2,342 $1,187 $3,529 $-367 $-429 $-199 $-349 $2,405 S-1,327 $-5 $-45 $-59 $-1,436 $322 $322 $1,285 $1,285 $-78 $1,529 $2,506 $898 $-1,063 $2,060 $1,043 $3,103 $-497 $-1,023 $-219 $58 $2,098 $-2,101 $-18 $-218 $-2,337 $89 $89 $296 $296 $189 $574 $312 $749 $-2,241 $1,727 $950 $2,677 $-25 $-179 $-681 $-497 $-61 $-3,415 $-115 $-666 $-4,196 $3,468 $-773.046 $1,041.789 $301.289 $1,343.078 $-216.565 $-632.867 $465 $4,415 $198 $467 $-595.069 $-693.861 $-123.829 $-1,280.802 $342.719 $16.667 $3,468 $1,718.19 $482 $1,865.551 $482 $1,865.551 $-888.663 $500.644 $356.809 $857.453 $46.267 $-369.364 $160.235 $3,743.976 $2,532.509 $334.225 $-433.537 $-493.289 $-524.499 $-1,634.85 $16.667 $-159.669 $-26.441 $-1,081.085 $-1,673.551 $1,718.19 $683.937 $-12.26 $683.937 $856.611 $856.611 $-17.025 $1,523.523 $-708.805 $197.999 Annual Data | Millions of US $ except per share data 2020-12-31 2019-12-31 2018-12-31 2017-12-31 2016-12-31 2015-12-31 Annual Data Current Ratio Long-term Debt / Capital Debt/Equity Ratio Gross Margin Operating Margin EBIT Margin EBITDA Margin Pre-Tax Profit Margin Net Profit Margin Asset Turnover Inventory Turnover Ratio Receiveable Turnover Days Sales In Receivables ROE - Return On Equity Return On Tangible Equity ROA- Return On Assets ROI - Return On Investment Book Value Per Share Operating Cash Flow Per Share Free Cash Flow Per Share EEEE Lu L. .... L.H .... L. L.hl L.H .... .... Lul Al .... EE 2020-12-31 1.8751 0.294 0.5087 21.0236 6.3229 6.3229 14.2567 3.6593 2.188 0.6047 6.0732 16.7211 21.8287 3.7356 3.8218 1.653 2.6375 24.0365 2.7761 1.3572 2019-12-31 1.1346 0.6091 1.7971 16.5555 -0.2807 -0.2807 9.2481 -2.7057 -3.5398 0.7164 5.7739 18.5634 19.6623 -10.379 -11.1833 -2.2589 -4.0574 8.2508 0.2518 1.2188 2018-12-31 0.8313 0.6203 2.0796 18.8342 -1.8079 -1.8079 7.7909 -4.6829 -4.5478 0.7216 5.5956 22.6143 16.1402 -18.4645 -19.6597 -3.5743 -7.0114 6.6555 2.5331 4.1845 2017-12-31 0.8561 0.6428 1.9705 18.9047 -13.8787 -13.8787 0.8079 -18.7856 -16.6851 0.4104 4.2129 22.8161 15.9975 -42.8114 -46.5629 -7.8205 -15.2938 6.2022 0.0982 -2.24 2016-12-31 1.0743 0.5149 1.2693 22.8461 -9.5333 -9.5333 5.3492 -10.6619 -9.6414 0.3089 2.6123 14.0243 26.0262 -13.9587 -14.9759 -3.4109 -6.7709 6.8557 0.6465 1.4207 2015-12-31 0.9897 0.6562 2.488 22.825 -17.7119 -17.7119 -5.3382 -21.6416 -21.9639 0.5015 2.4436 23.9459 15.2427 -82.0024 -82.9837 -11.0148 -28.1929 1.6492 -0.7261 -1.7191
Step by Step Solution
There are 3 Steps involved in it
Here are the calculations for the projections with exact figures RevenueSales Growth Reven... View full answer

Get step-by-step solutions from verified subject matter experts