

Question: 4 pts Question 6 Enter the following table into your calculator or the Desmos Grapher and create the scatterplot. X y 2 60 33 2,100
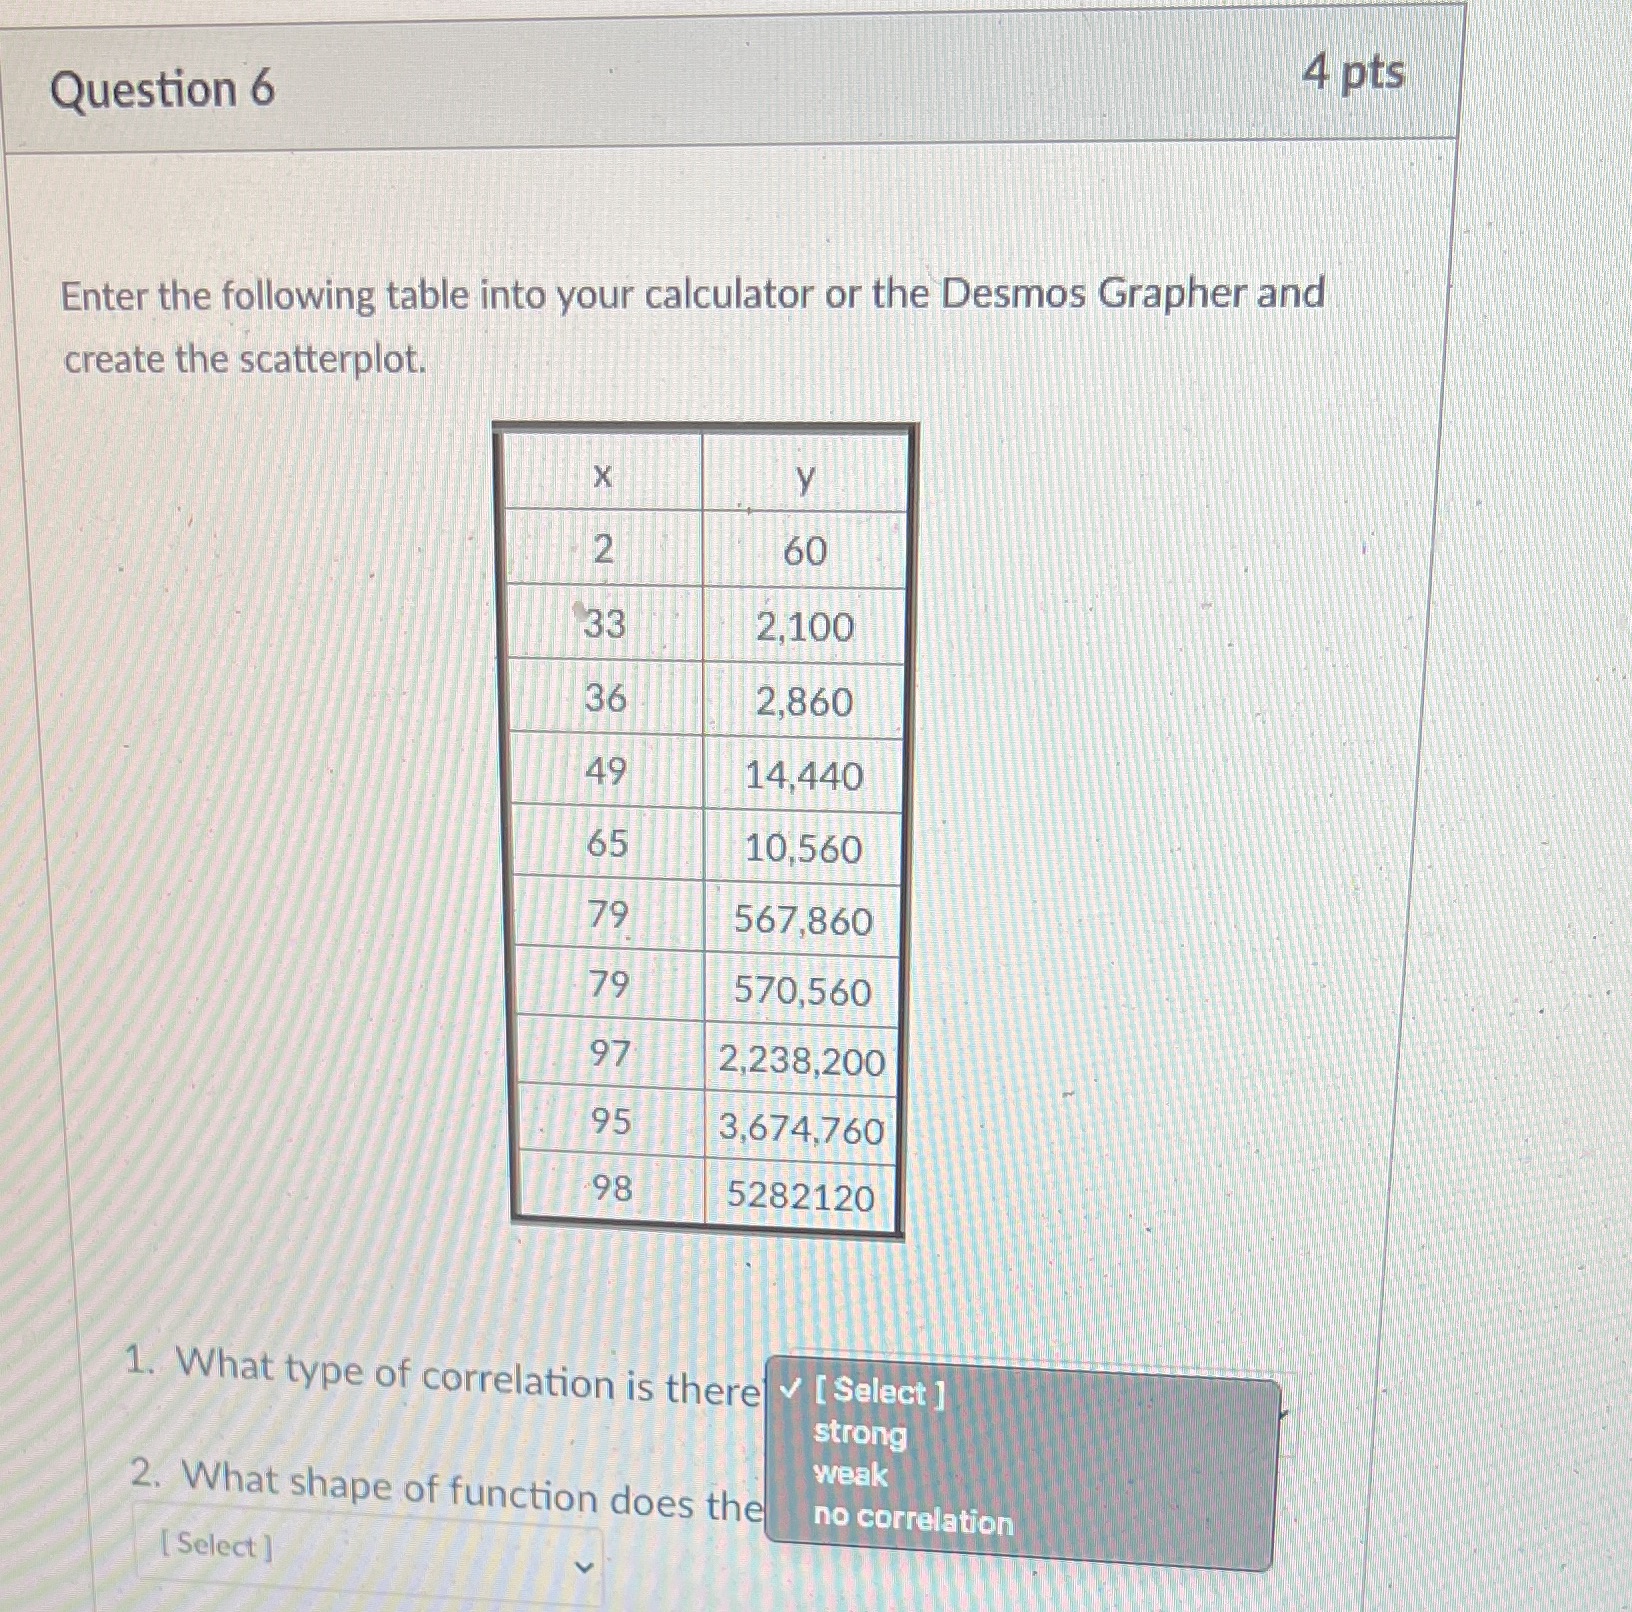
4 pts Question 6 Enter the following table into your calculator or the Desmos Grapher and create the scatterplot. X y 2 60 33 2,100 36 2,860 49 14,440 65 10,560 79 567,860 79 570,560 97 2,238,200 95 3,674,760 98 5282120 1. What type of correlation is there v [ Select ] strong weak 2. What shape of function does the no correlation [ Select ]
Step by Step Solution
There are 3 Steps involved in it
1 Expert Approved Answer
Step: 1 Unlock

Question Has Been Solved by an Expert!
Get step-by-step solutions from verified subject matter experts
Step: 2 Unlock
Step: 3 Unlock