

Question: 4 questions plz Suppose a quantitative variable has the following 5-number summary: Min = 25, Q1 = 54, Median = 58, Q3 = 64, Max
4 questions plz
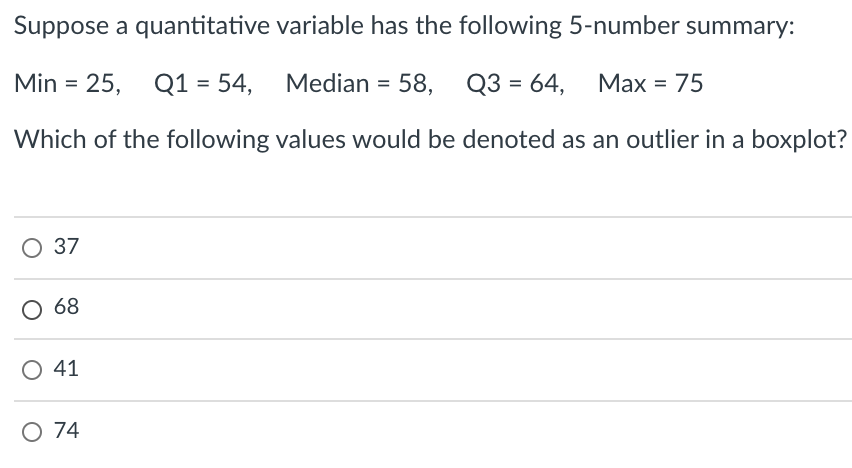
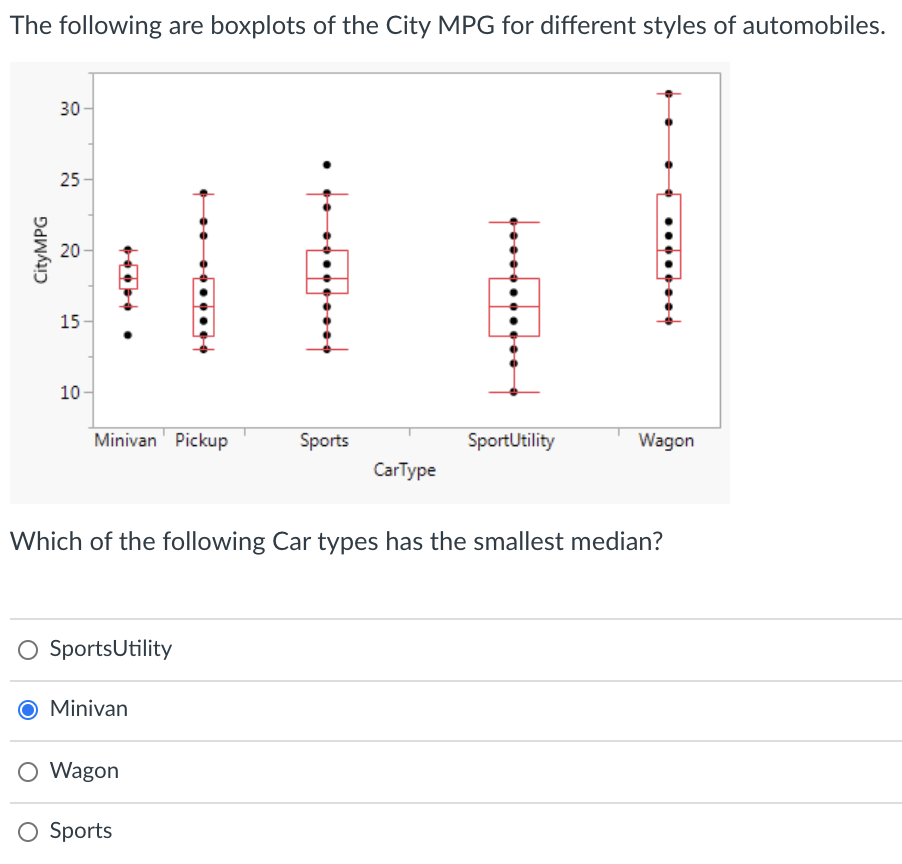
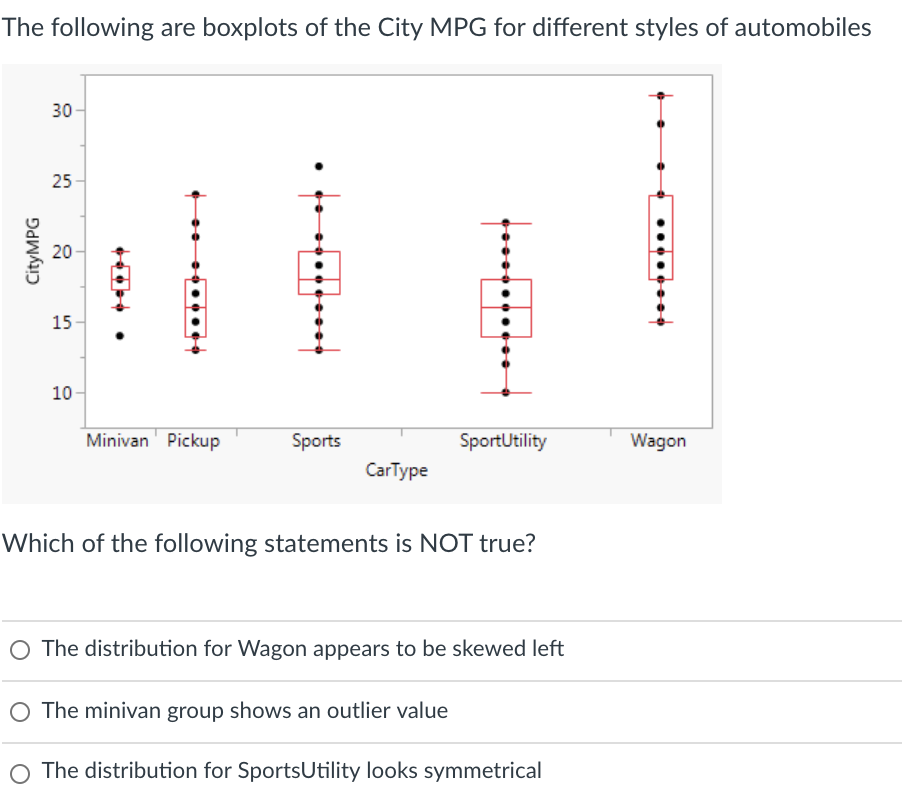
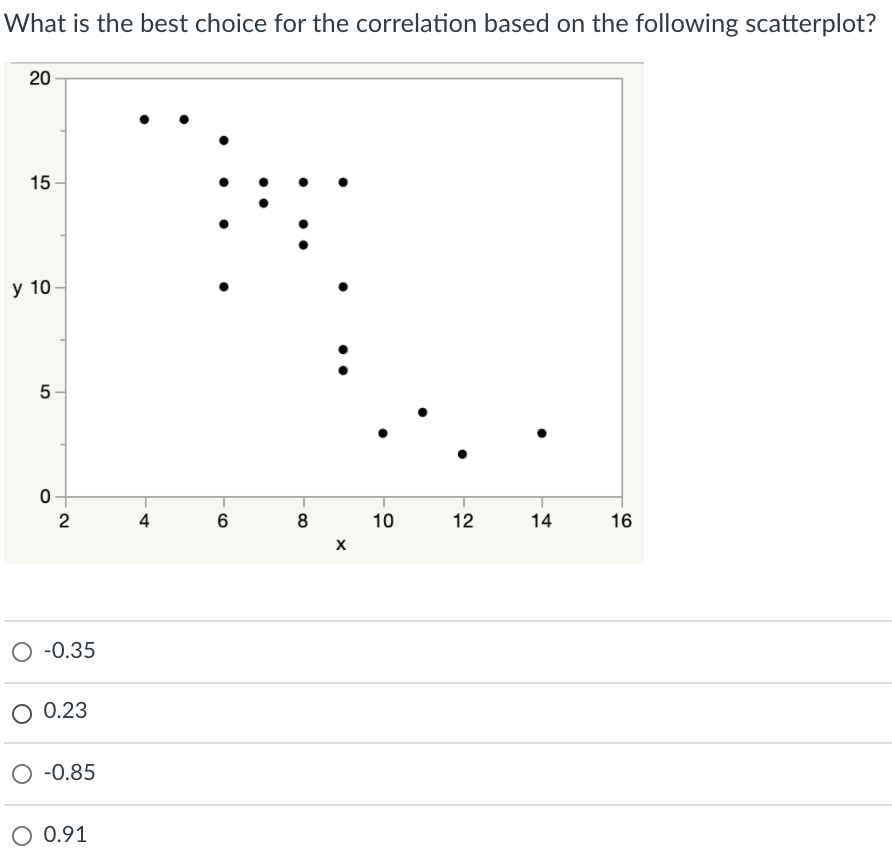
Suppose a quantitative variable has the following 5-number summary: Min = 25, Q1 = 54, Median = 58, Q3 = 64, Max = 75 Which of the following values would be denoted as an outlier in a boxplot? O 37 O 68 O 41 O 74The following are boxplots of the City MPG for different styles of automobiles. Minivan Pickup Sports SpoctUtility Wagon Which of the following Car types has the smallest median? O SportsUtility Minivan 0 Wagon 0 Sports The following are boxplots of the City MPG for different styles of automobiles 30 25 CityMPG 20 15 for... 10- Minivan Pickup Sports SportUtility Wagon CarType Which of the following statements is NOT true? O The distribution for Wagon appears to be skewed left O The minivan group shows an outlier value The distribution for SportsUtility looks symmetricalWhat is the best choice for the correlation based on the following scatterplot? 20 15 y 10- . 5 0 - No. 4 6 8 10 12 14 X 16 O -0.35 O 0.23 O -0.85 O 0.91
Step by Step Solution
There are 3 Steps involved in it

Get step-by-step solutions from verified subject matter experts