

Question: 4. Risk and Return [25 Marks] 1) Diversification. Here are the returns on two stocks. Stock N (%) 6 January February -4 March 5 April
![4. Risk and Return [25 Marks] 1) Diversification. Here are the](https://dsd5zvtm8ll6.cloudfront.net/si.experts.images/questions/2024/09/66ec86592aa2c_92066ec8658b656e.jpg)
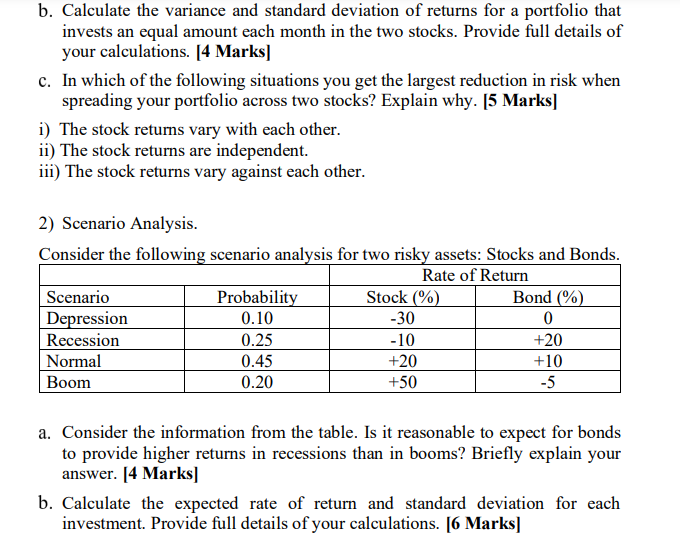
4. Risk and Return [25 Marks] 1) Diversification. Here are the returns on two stocks. Stock N (%) 6 January February -4 March 5 April 13 May 2 June 5 July -5 ECO-20007 (June 2022) Page 5 of 12 a. Calculate the variance and standard deviation of each stock's returns. Which stock is riskier if held on its own? Provide full details of your calculations. [6 Marks] Stock M (%) 12 6 8 4 -6 3 -7 b. Calculate the variance and standard deviation of returns for a portfolio that invests an equal amount each month in the two stocks. Provide full details of your calculations. [4 Marks] c. In which of the following situations you get the largest reduction in risk when spreading your portfolio across two stocks? Explain why. [5 Marks] i) The stock returns vary with each other. ii) The stock returns are independent. iii) The stock returns vary against each other. 2) Scenario Analysis. Consider the following scenario analysis for two risky assets: Stocks and Bonds. Rate of Return Scenario Probability Stock (%) Bond (%) Depression 0.10 -30 0 Recession 0.25 -10 +20 Normal 0.45 +20 +10 Boom 0.20 +50 -5 a. Consider the information from the table. Is it reasonable to expect for bonds to provide higher returns in recessions than in booms? Briefly explain your answer. [4 Marks] b. Calculate the expected rate of return and standard deviation for each investment. Provide full details of your calculations. [6 Marks] 4. Risk and Return [25 Marks] 1) Diversification. Here are the returns on two stocks. Stock N (%) 6 January February -4 March 5 April 13 May 2 June 5 July -5 ECO-20007 (June 2022) Page 5 of 12 a. Calculate the variance and standard deviation of each stock's returns. Which stock is riskier if held on its own? Provide full details of your calculations. [6 Marks] Stock M (%) 12 6 8 4 -6 3 -7 b. Calculate the variance and standard deviation of returns for a portfolio that invests an equal amount each month in the two stocks. Provide full details of your calculations. [4 Marks] c. In which of the following situations you get the largest reduction in risk when spreading your portfolio across two stocks? Explain why. [5 Marks] i) The stock returns vary with each other. ii) The stock returns are independent. iii) The stock returns vary against each other. 2) Scenario Analysis. Consider the following scenario analysis for two risky assets: Stocks and Bonds. Rate of Return Scenario Probability Stock (%) Bond (%) Depression 0.10 -30 0 Recession 0.25 -10 +20 Normal 0.45 +20 +10 Boom 0.20 +50 -5 a. Consider the information from the table. Is it reasonable to expect for bonds to provide higher returns in recessions than in booms? Briefly explain your answer. [4 Marks] b. Calculate the expected rate of return and standard deviation for each investment. Provide full details of your calculations. [6 Marks]
Step by Step Solution
There are 3 Steps involved in it

Get step-by-step solutions from verified subject matter experts