

Question: 4) Run a regression analysis to predict depression using age, physical health, and mental health as independent variables. Select Analyze >Regression >Linear. Then insert CESD
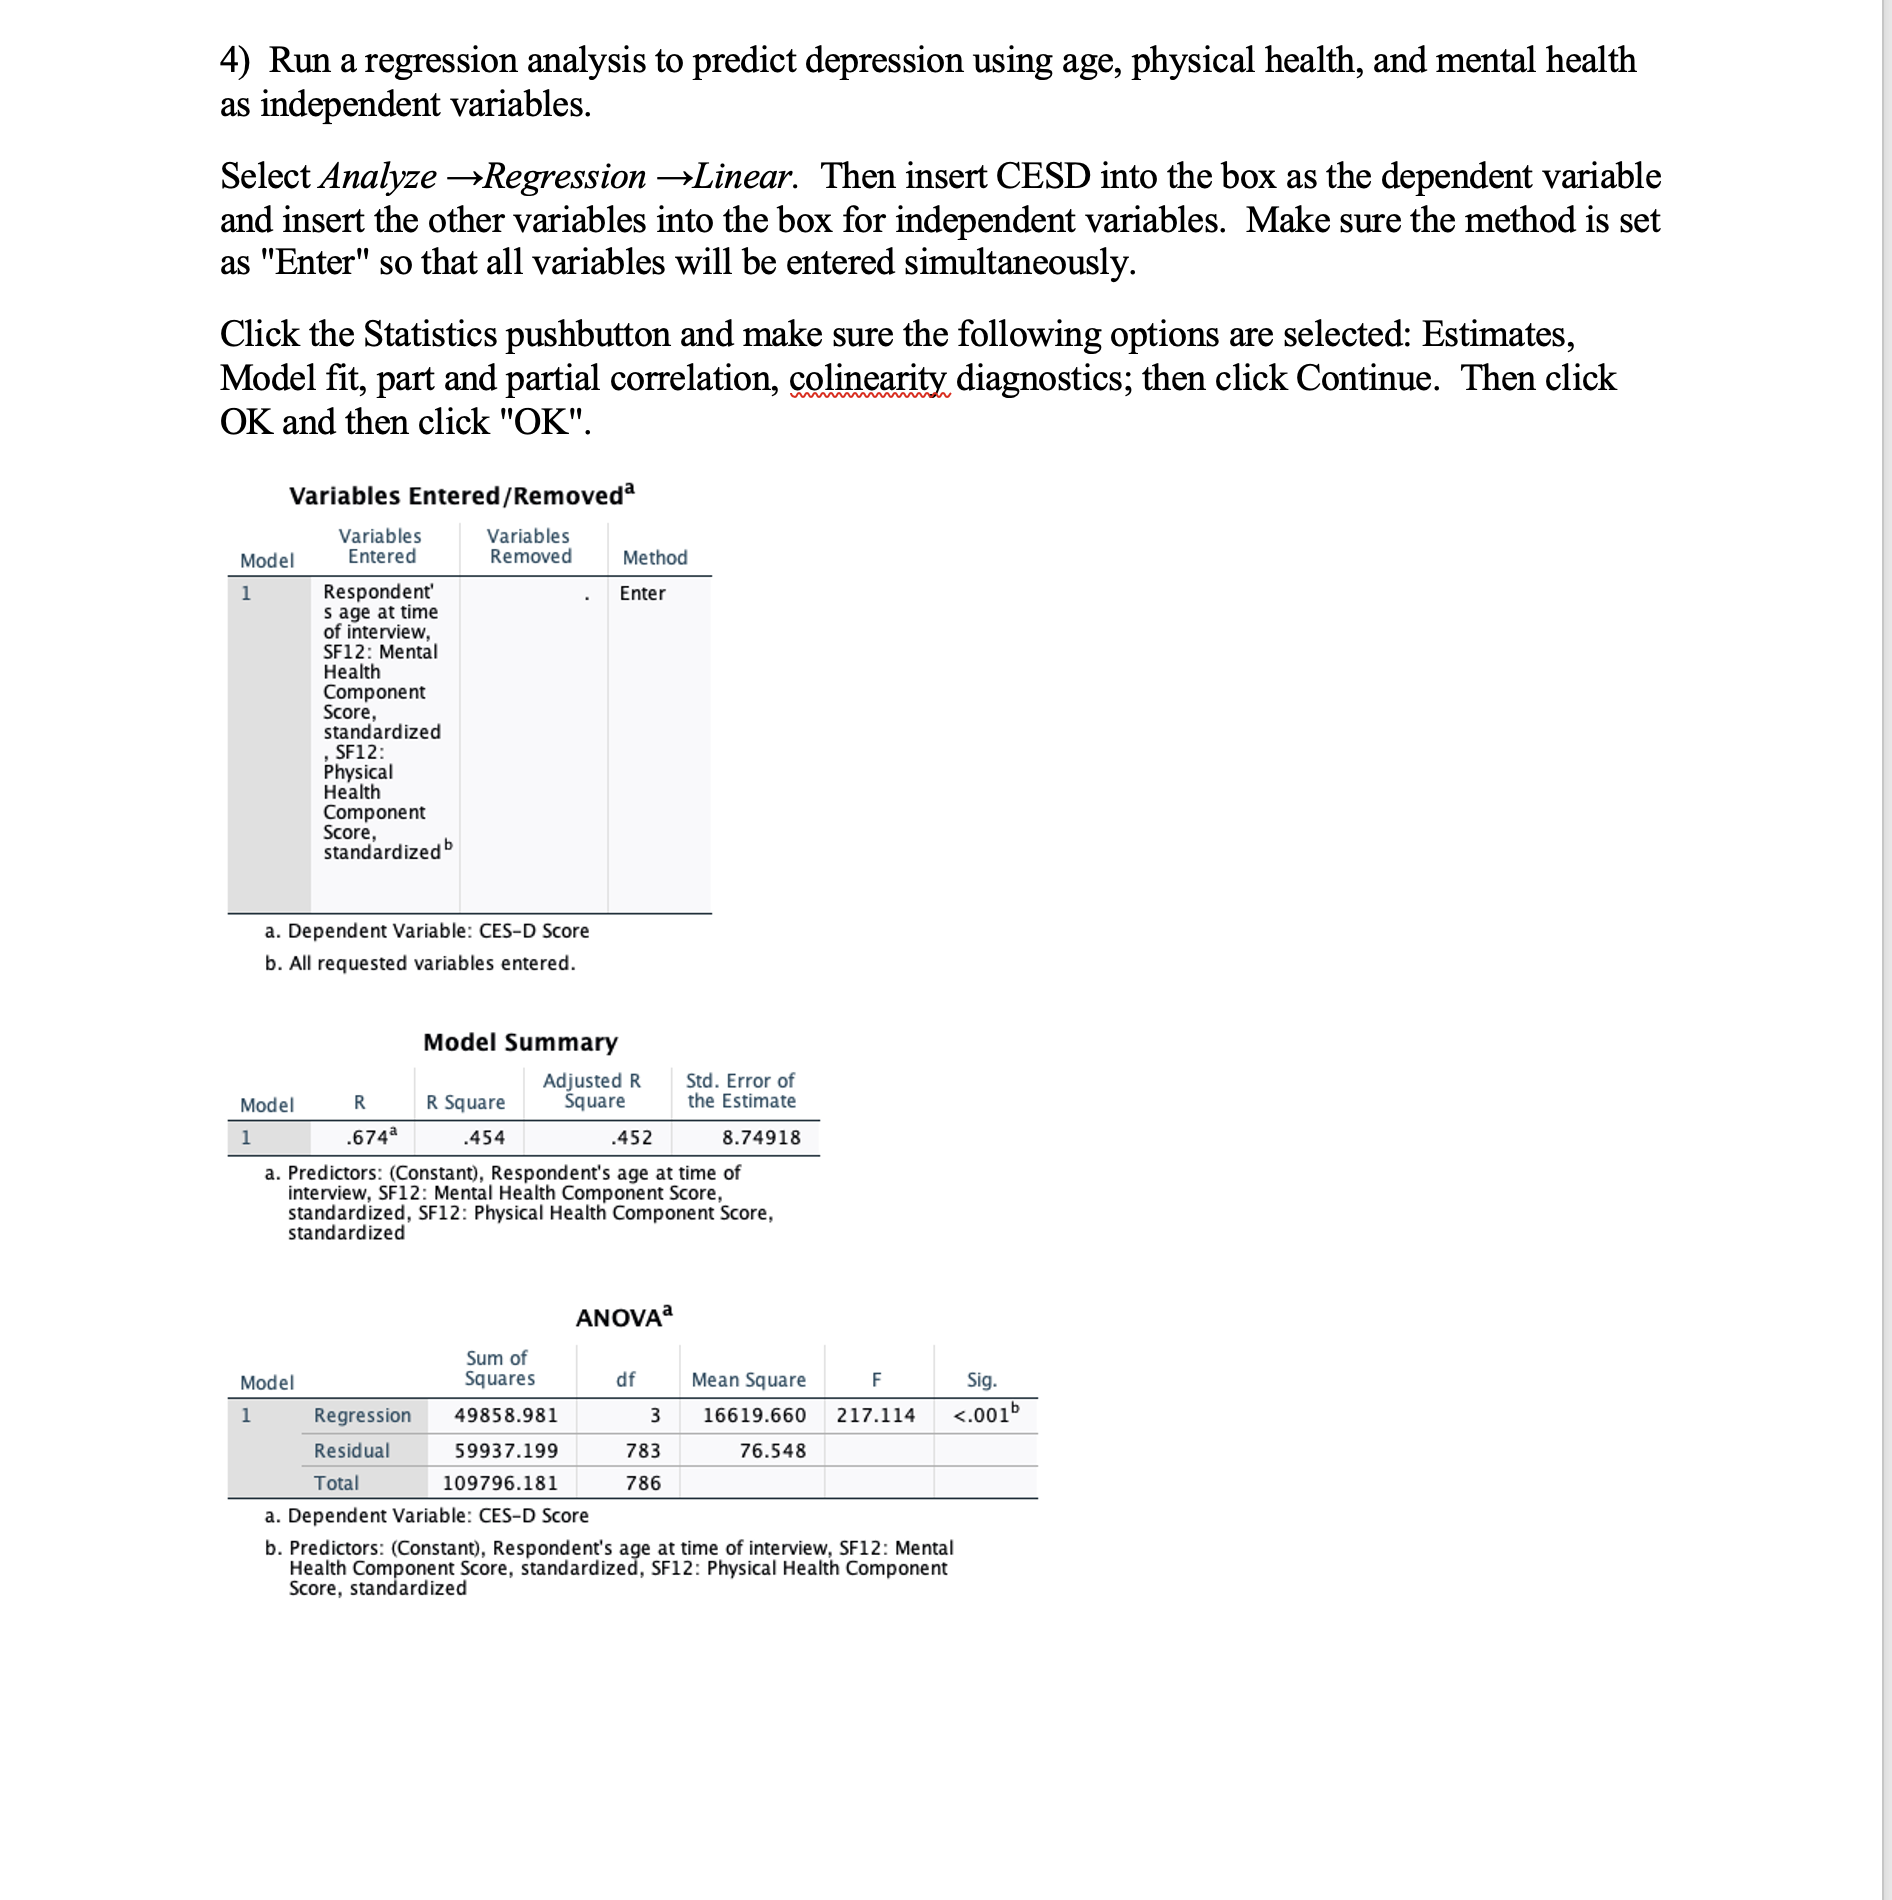
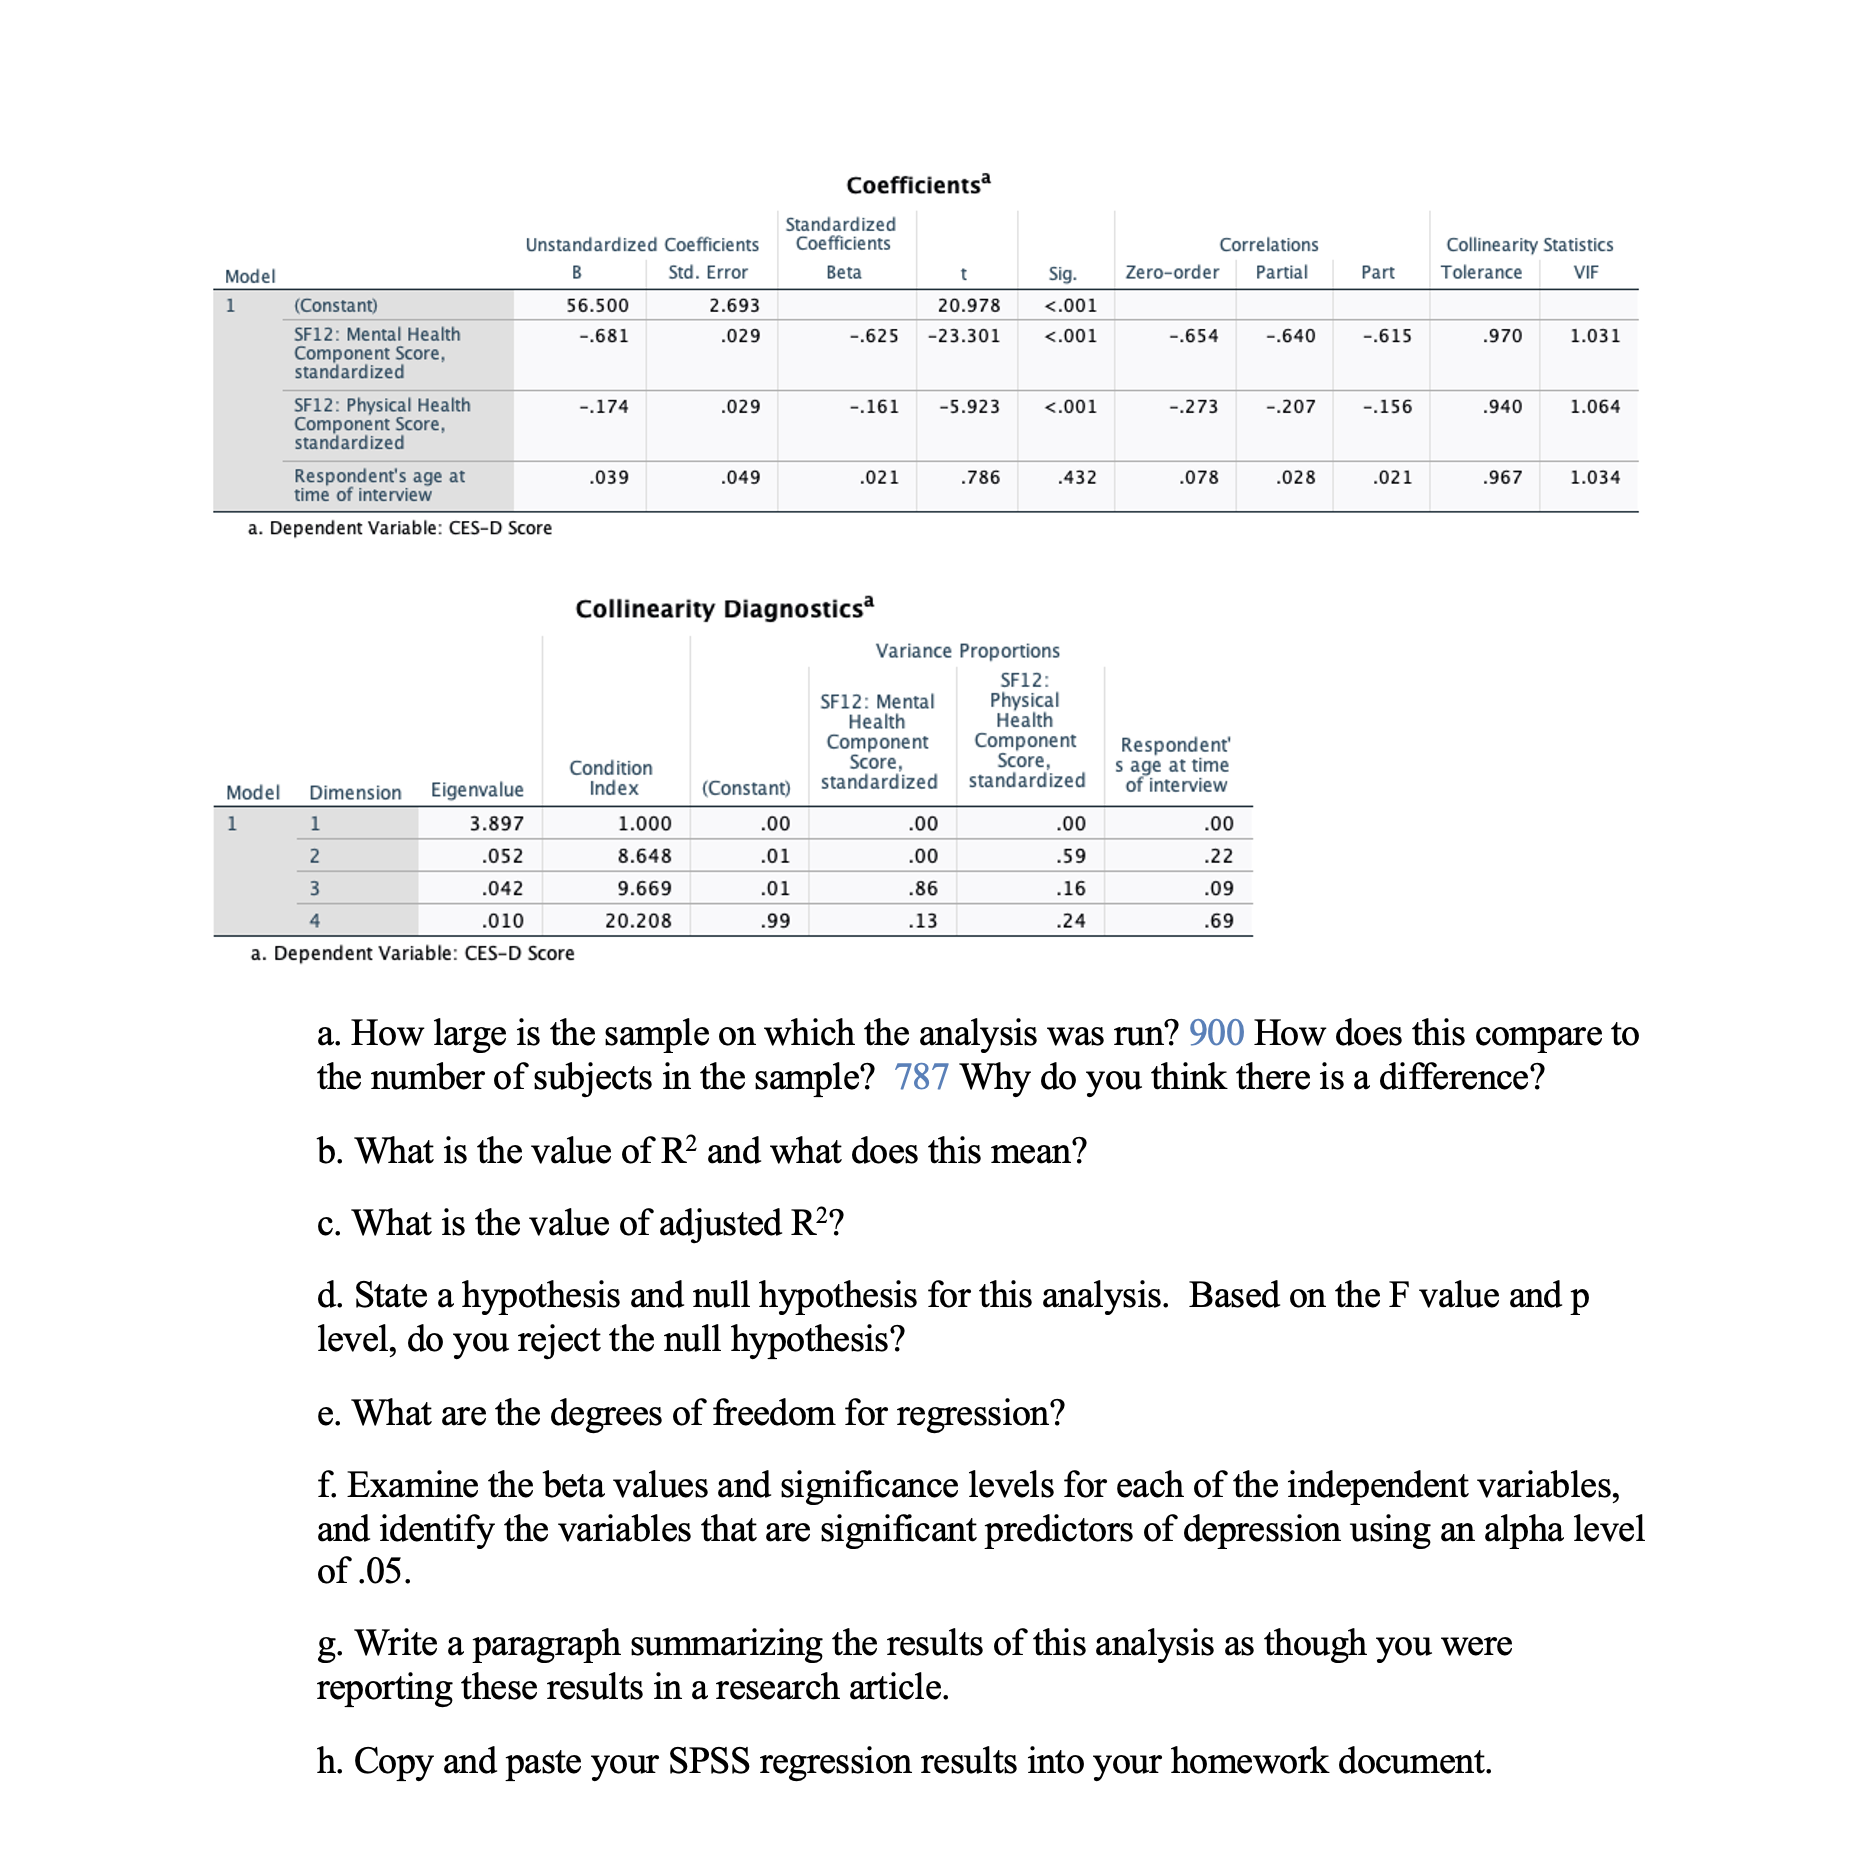
4) Run a regression analysis to predict depression using age, physical health, and mental health as independent variables. Select Analyze >Regression >Linear. Then insert CESD into the box as the dependent variable and insert the other variables into the box for independent variables. Make sure the method is set as "Enter" so that all variables will be entered simultaneously. Click the Statistics pushbutton and make sure the following options are selected: Estimates, Model t, part and partial correlation, colinearity diagnostics; then click Continue. Then click OK and then click "OK". Variables Entered [Removeda Variables Variables Model Entered Removed Method 1 Respondent\" . Enter 5 age at time of Interview. SF12: Mental Health Component Score. standardized , :22:I P in Health Component Score, standardized\" a. Dependent Variable: CESD Score b. All requested variables entered. Model Summary Adjusted R Std. Error 01 Model R 11 Square Square the Estimate 1 .674i .454 .452 8.74918 a. Predictors: (Constant), Respondent's age at time of interview. SF12: Mental Health Component Score. standardized. SF12: Physical Health Component Score, standardized ANOVAa Sum of Model Squares of Mean Square F Sig. 1 Regression 49858381 3 16619.660 2 17.114 <.001 residual total l a. dependent variable: ces-d score b. predictors: respondent a at time of interview sf12: mental health corn onent standardize physical component score. sta ardized coefficients standardized unstandardized correlations collinearity statistics model std. error beta sig. zero-order partial part tolerance vie .693 .029 .970 he .940 age .039 .049 .021 .432 .078 .028 .967 diagnostics variance proportions hysica condition s dimension eigenvalue index .00 .0 w .042 .86 .16 .09 .24 how large is the sample on which analysis was run does this compare to number subjects in why do you think there difference what value r2 and mean c. adjusted d. state hypothesis null for analysis. based f p level reject e. are degrees freedom regression f. examine values significance levels each independent variables identify that significant predictors depression using an alpha .05. g. write paragraph summarizing results as though were reporting these research article. h. copy paste your spss into homework document>
Step by Step Solution
There are 3 Steps involved in it

Get step-by-step solutions from verified subject matter experts