

Question: 4. Sample size, statistical significance, and practical importance Cities across the country are passing higher minimum wages, increasing the discrepancy between the wages in the
4. Sample size, statistical significance, and practical importance
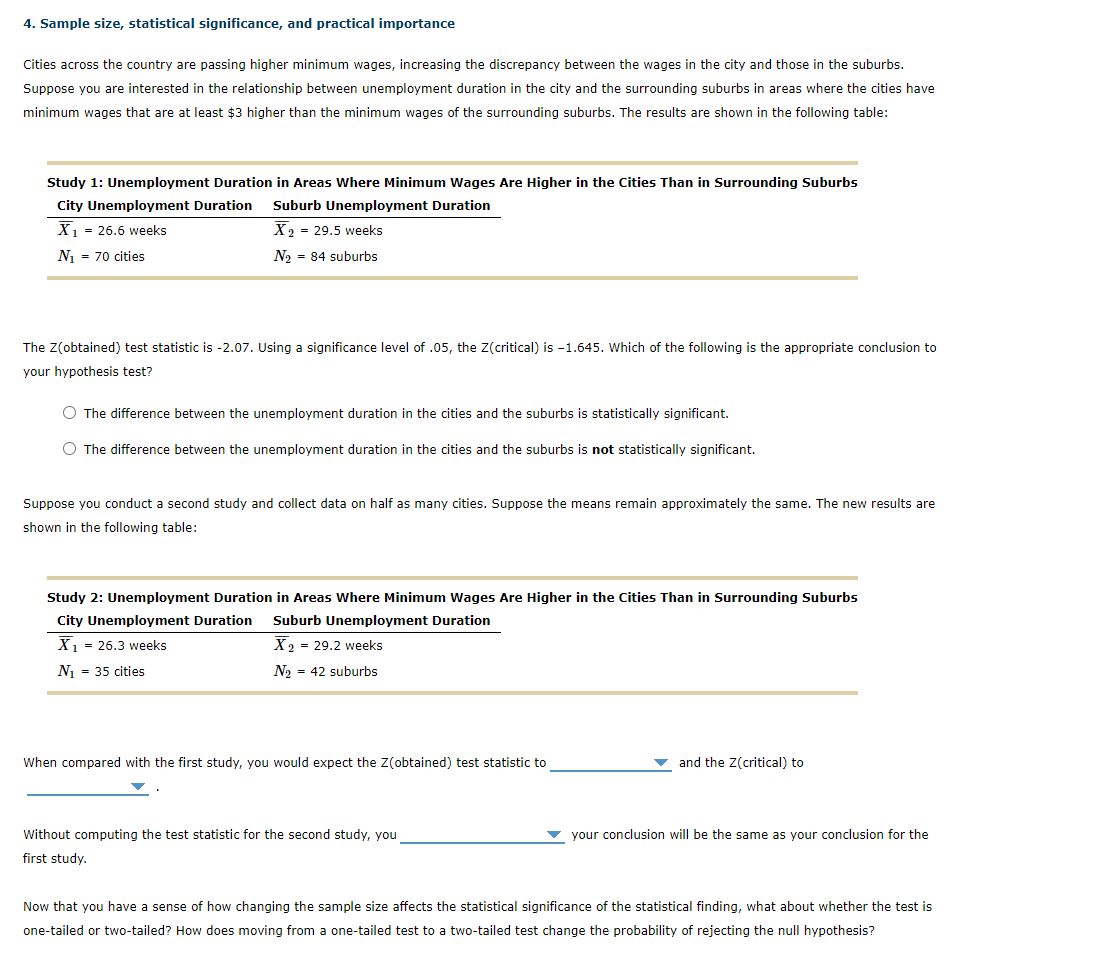
Cities across the country are passing higher minimum wages, increasing the discrepancy between the wages in the city and those in the suburbs. Suppose you are interested in the relationship between unemployment duration in the city and the surrounding suburbs in areas where the cities have minimum wages that are at least $3 higher than the minimum wages of the surrounding suburbs. The results are shown in the following table:
Study 1: Unemployment Duration in Areas Where Minimum Wages Are Higher in the Cities Than in Surrounding Suburbs
City Unemployment Duration
Suburb Unemployment Duration
X1X?1= 26.6 weeks
X2X?2= 29.5 weeks
N1N1= 70 cities
N2N2= 84 suburbs
The Z(obtained) test statistic is -2.07. Using a significance level of .05, the Z(critical) is -1.645. Which of the following is the appropriate conclusion to your hypothesis test? CHOOSE
The difference between the unemployment duration in the cities and the suburbs is statistically significant.
The difference between the unemployment duration in the cities and the suburbs isnotstatistically significant.
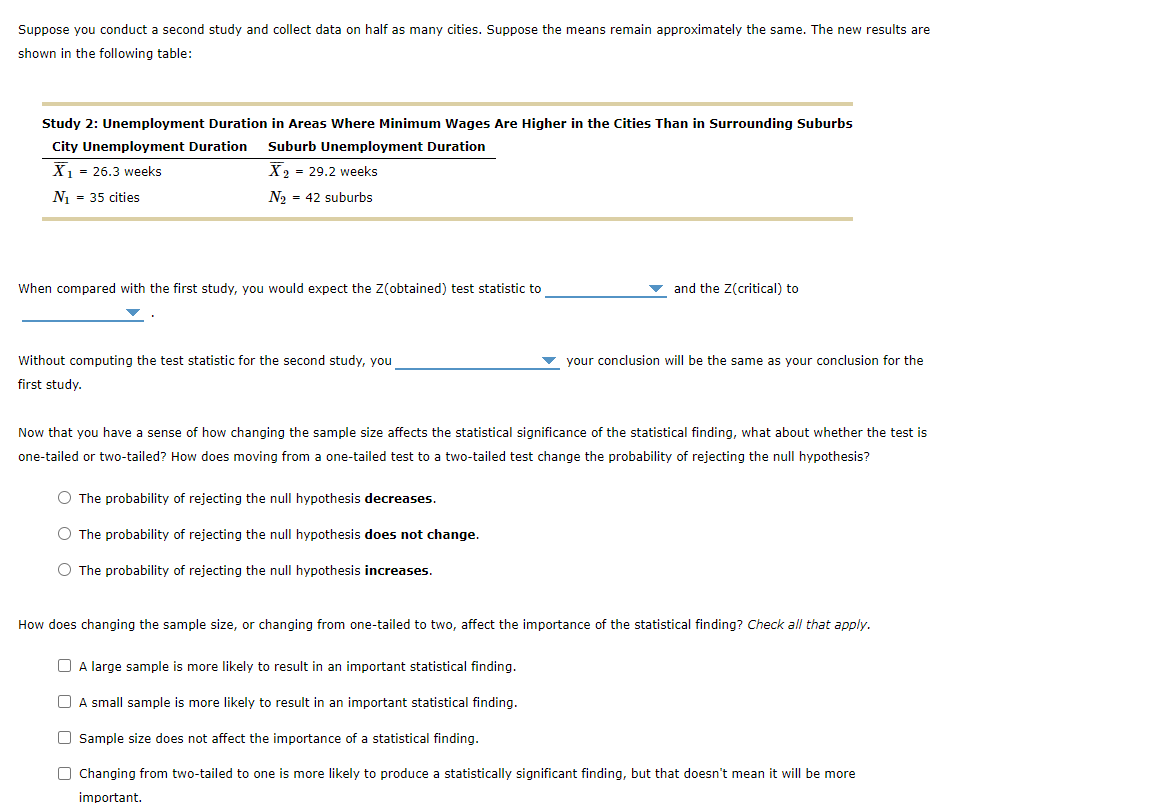
Suppose you conduct a second study and collect data on half as many cities. Suppose the means remain approximately the same. The new results are shown in the following table:
Study 2: Unemployment Duration in Areas Where Minimum Wages Are Higher in the Cities Than in Surrounding Suburbs
City Unemployment Duration
Suburb Unemployment Duration
X1X?1= 26.3 weeks
X2X?2= 29.2 weeks
N1N1= 35 cities
N2N2= 42 suburbs
When compared with the first study, you would expect the Z(obtained) test statistic to _____ choices are increase, decrease and stay the same ?ANDthe Z(critical) to _____ choices are increase, decrease and stay the same ?.
Without computing the test statistic for the second study, you _______ choices are: know, and don't know whether?your conclusion will be the same as your conclusion for the first study.
Now that you have a sense of how changing the sample size affects the statistical significance of the statistical finding, what about whether the test is one-tailed or two-tailed? How does moving from a one-tailed test to a two-tailed test change the probability of rejecting the null hypothesis?
The probability of rejecting the null hypothesisdecreases.
The probability of rejecting the null hypothesisdoes not change.
The probability of rejecting the null hypothesisincreases.
How does changing the sample size, or changing from one-tailed to two, affect the importance of the statistical finding?Check all that apply.
A large sample is more likely to result in an important statistical finding.
A small sample is more likely to result in an important statistical finding.
Sample size does not affect the importance of a statistical finding.
Changing from two-tailed to one is more likely to produce a statistically significant finding, but that doesn't mean it will be more important.
Please see explanation for this I am still getting points off. thanks
4. Sample size, statistical significance, and practical importance Cities across the country are passing higher minimum wages, increasing the discrepancy between the wages in the city and those in the suburbs. Suppose you are interested in the relationship between unemployment duration in the city and the surrounding suburbs in areas where the cities have minimum wages that are at least $3 higher than the minimum wages of the surrounding suburbs. The results are shown in the following table: Study 1: Unemployment Duration in Areas Where Minimum Wages Are Higher in the Cities Than in Surrounding Suburbs City Unemployment Duration Suburb Unemployment Duration X 1 = 26.6 weeks X2 = 29.5 weeks N1 = 70 cities N2 = 84 suburbs The Z(obtained) test statistic is -2.07. Using a significance level of .05, the Z(critical) is -1.645. Which of the following is the appropriate conclusion to your hypothesis test? O The difference between the unemployment duration in the cities and the suburbs is statistically significant. O The difference between the unemployment duration in the cities and the suburbs is not statistically significant. Suppose you conduct a second study and collect data on half as many cities. Suppose the means remain approximately the same. The new results are shown in the following table: Study 2: Unemployment Duration in Areas Where Minimum Wages Are Higher in the Cities Than in Surrounding Suburbs City Unemployment Duration Suburb Unemployment Duration X1 = 26.3 weeks X 2 = 29.2 weeks N = 35 cities N2 = 42 suburbs When compared with the first study, you would expect the Z(obtained) test statistic to and the Z(critical) to Without computing the test statistic for the second study, you your conclusion will be the same as your conclusion for the first study. Now that you have a sense of how changing the sample size affects the statistical significance of the statistical finding, what about whether the test is one-tailed or two-tailed? How does moving from a one-tailed test to a two-tailed test change the probability of rejecting the null hypothesis?Suppose you conduct a second study and collect data on half as many cities. Suppose the means remain approximately the same. The new results are shown in the following table: Study 2: Unemployment Duration in Areas Where Minimum Wages Are Higher in the Cities Than in Surrounding Suburbs City Unemployment Duration Suburb Unemployment Duration X 1 = 26.3 weeks X2 = 29.2 weeks N = 35 cities N2 = 42 suburbs When compared with the first study, you would expect the Z(obtained) test statistic to and the Z(critical) to Without computing the test statistic for the second study, you your conclusion will be the same as your conclusion for the first study. Now that you have a sense of how changing the sample size affects the statistical significance of the statistical finding, what about whether the test is one-tailed or two-tailed? How does moving from a one-tailed test to a two-tailed test change the probability of rejecting the null hypothesis? O The probability of rejecting the null hypothesis decreases. O The probability of rejecting the null hypothesis does not change. O The probability of rejecting the null hypothesis increases. How does changing the sample size, or changing from one-tailed to two, affect the importance of the statistical finding? Check all that apply. O A large sample is more likely to result in an important statistical finding. A small sample is more likely to result in an important statistical finding. Sample size does not affect the importance of a statistical finding. O Changing from two-tailed to one is more likely to produce a statistically significant finding, but that doesn't mean it will be more
Step by Step Solution
There are 3 Steps involved in it

Get step-by-step solutions from verified subject matter experts