

Question: 4. See Table 2.5 showing financial statement data and stock price data for Mydeco Corp. 1) From 2009 to 2013, what was the total cash
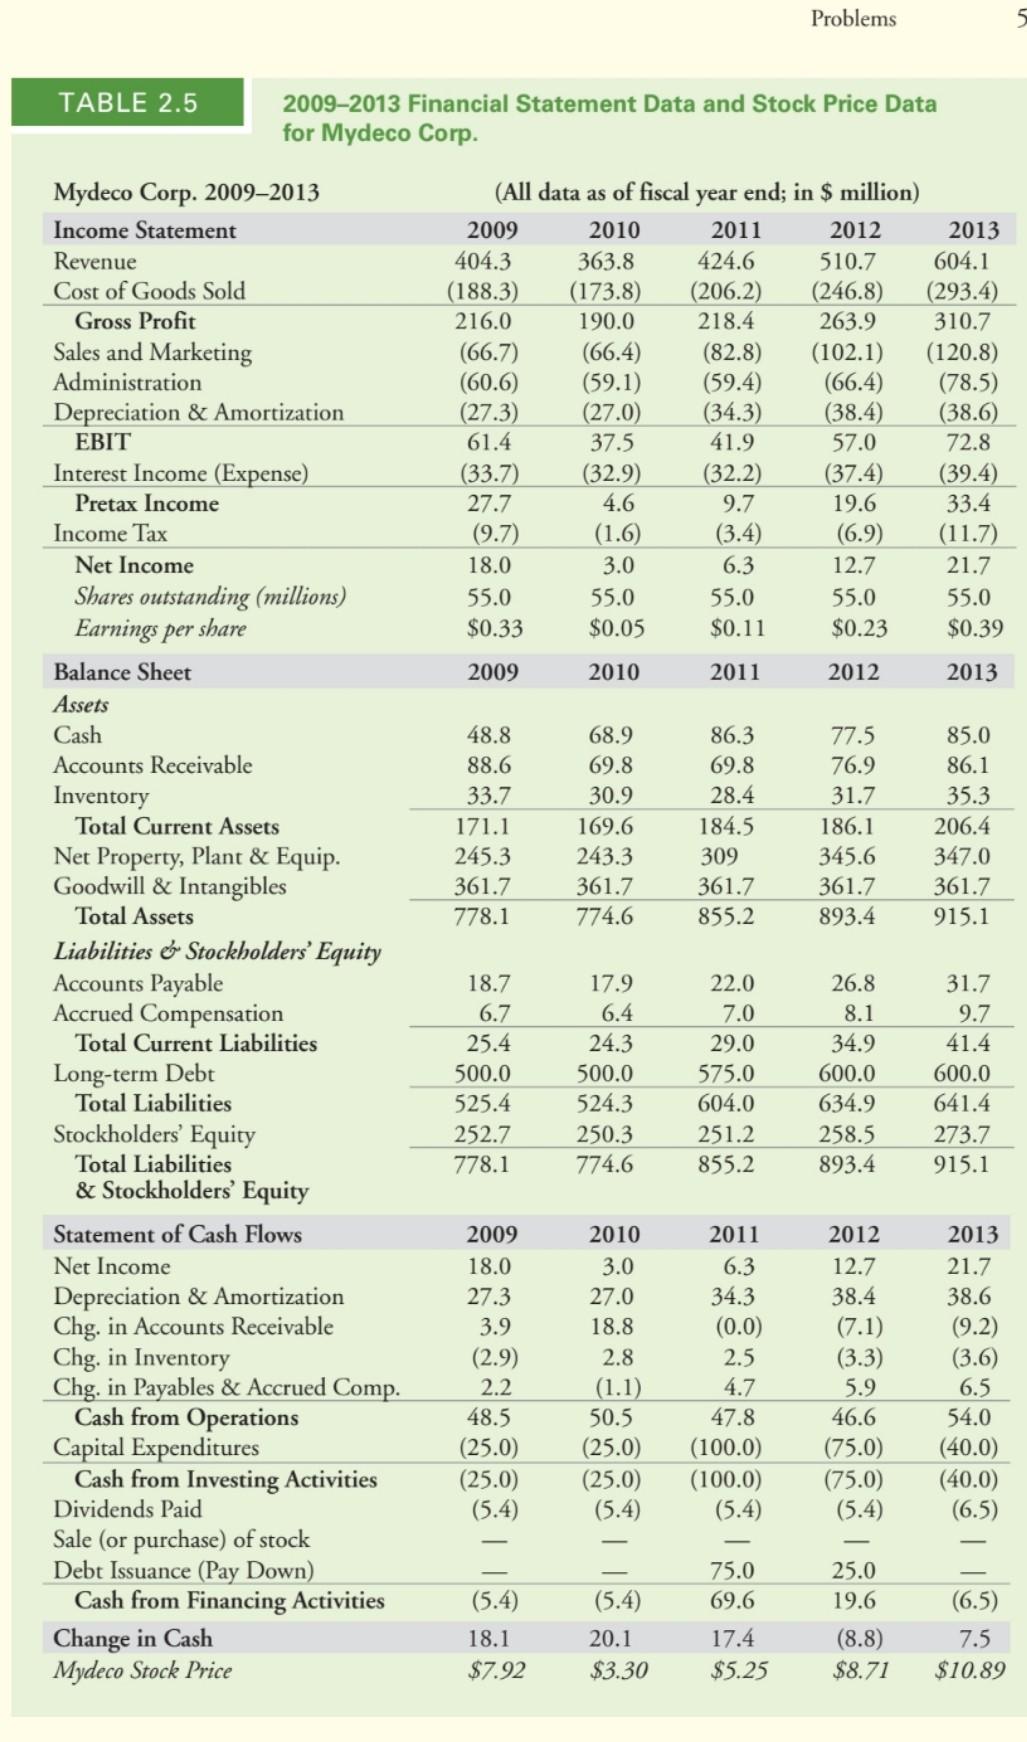
4. See Table 2.5 showing financial statement data and stock price data for Mydeco Corp. 1) From 2009 to 2013, what was the total cash flow from operations that Mydeco generated? 2) What fraction of the total cash flow from operations was spent on capital expenditures? 3What fraction of the total cash flow from operations was spent paying dividends to shareholders? 4 What were Mydecos accounts receivable and inventory at the end of 2008? 5) What were Mydecos total liabilities at the end of 2008? 6) Assuming goodwill and intangibles were equal in 2008 and 2009, what was Mydecos net property, plant, and equipment at the end of 2008?
Problems TABLE 2.5 2009-2013 Financial Statement Data and Stock Price Data for Mydeco Corp. (All data as of fiscal year end; in $ million) 2009 2010 2011 2012 2013 404.3 363.8 424.6 510.7 604.1 (188.3) (173.8) (206.2) (246.8) (293.4) 216.0 190.0 218.4 263.9 310.7 (66.7) (66.4) (82.8) (102.1) (120.8) (60.6) (59.1) (59.4) (66.4) (78.5) (27.3) (27.0) (34.3) (38.4) (38.6) 61.4 37.5 41.9 57.0 72.8 (33.7) (32.9) (32.2) (37.4) (39.4) 27.7 4.6 9.7 19.6 33.4 (9.7) (1.6) (3.4) (6.9) (11.7) 18.0 3.0 6.3 12.7 21.7 55.0 55.0 55.0 55.0 55.0 $0.33 $0.05 $0.11 $0.23 $0.39 2009 2010 2011 2012 2013 48.8 88.6 33.7 171.1 245.3 361.7 778.1 68.9 69.8 30.9 169.6 243.3 361.7 774.6 86.3 69.8 28.4 184.5 309 361.7 855.2 77.5 76.9 31.7 186.1 345.6 361.7 893.4 85.0 86.1 35.3 206.4 347.0 361.7 915.1 Mydeco Corp. 20092013 Income Statement Revenue Cost of Goods Sold Gross Profit Sales and Marketing Administration Depreciation & Amortization EBIT Interest Income (Expense) Pretax Income Income Tax Net Income Shares outstanding (millions) Earnings per share Balance Sheet Assets Cash Accounts Receivable Inventory Total Current Assets Net Property, Plant & Equip. Goodwill & Intangibles Total Assets Liabilities - Stockholders' Equity Accounts Payable Accrued Compensation Total Current Liabilities Long-term Debt Total Liabilities Stockholders' Equity Total Liabilities & Stockholders' Equity Statement of Cash Flows Net Income Depreciation & Amortization Chg. in Accounts Receivable Chg. in Inventory Chg. in Payables & Accrued Comp. Cash from Operations Capital Expenditures Cash from Investing Activities Dividends Paid Sale (or purchase) of stock Debt Issuance (Pay Down) Cash from Financing Activities Change in Cash Mydeco Stock Price 18.7 6.7 25.4 500.0 525.4 252.7 778.1 17.9 6.4 24.3 500.0 524.3 250.3 774.6 22.0 7.0 29.0 575.0 604.0 251.2 855.2 26.8 8.1 34.9 600.0 634.9 258.5 893.4 31.7 9.7 41.4 600.0 641.4 273.7 915.1 2012 12.7 38.4 2009 18.0 27.3 3.9 (2.9) 2.2 48.5 (25.0) (25.0) (5.4) 2010 3.0 27.0 18.8 2.8 (1.1) 50.5 (25.0) (25.0) (5.4) 2011 6.3 34.3 (0.0) 2.5 4.7 47.8 (100.0) (100.0) (5.4) (7.1) (3.3) 5.9 46.6 (75.0) (75.0) (5.4) 2013 21.7 38.6 (9.2) (3.6) 6.5 54.0 (40.0) (40.0) (6.5) 75.0 69.6 (5.4) 18.1 $7.92 (5.4) 20.1 $3.30 25.0 19.6 (8.8) $8.71 17.4. $5.25 (6.5) 7.5 $10.89
Step by Step Solution
There are 3 Steps involved in it

Get step-by-step solutions from verified subject matter experts