

Question: 4. Summarizing nominal data - Pie charts The market capitalization of a publicly traded company is its stock price multiplied by the number of its
4. Summarizing nominal data - Pie charts
The market capitalization of a publicly traded company is its stock price multiplied by the number of its outstanding shares.
The Standard & Poors (S&P) 500 Index lists 500 of the largest publicly traded companies (by market capitalization) in the United States. It is widely considered the leading indicator of the U.S. equities market.
The S&P 500 companies are classified into 10 industry sectors according to the Global Industry Classification Standard (GICS) developed by Morgan Stanley Capital International (MSCI) and S&P.
A data set containing the names of these companies and their GICS codes and sectors is displayed in the following DataView tool.
Data SetS&P 500 Index
Population
Variables = 3
Observations = 500
Variables>Observations>
Variable
Variable
Variable
Correlation
Correlation
S&P 500 Companies and Their Industry Classifications
Data obtained from the Standard & Poor's website
| Variable | Type | Form | Observations | |
|---|---|---|---|---|
| Values | Missing | |||
| GICS Code | Qualitative | Numeric | 500 | 0 |
| GICS Sector | Qualitative | Nonnumeric | 500 | 0 |
| S&P 100 | Qualitative | Nonnumeric | 500 | 0 |
Using the tool, make a pie chart that graphically shows the relative frequencies of the S&P 500 companies according to their GICS sectors. Click on one of the Variable sliding panels on the left side of the tool screen, and select the variable GICS Sector. Then click on the Pie Chart button.
What is the percent frequency of S&P 500 companies in the Financials sector?
11.0%
17.6%
10.4%
0.176%
The S&P 100 Index lists 100 leading U.S. stocks with exchange-listed options. It was developed by the Chicago Board of Options Exchange (CBOE) and later transferred to S&P. The constituents of the S&P 100 form a subset of the S&P 500 and are among its largest and most established companies.
The following tool displays the same set of data as the previous tool.
Data SetS&P 500 Index
Population
Variables = 3
Observations = 500
Variables>Observations>
Variable
Variable
Variable
Correlation
Correlation
S&P 500 Companies and Their Industry Classifications
Data obtained from the Standard & Poor's website
| Variable | Type | Form | Observations | |
|---|---|---|---|---|
| Values | Missing | |||
| GICS Code | Qualitative | Numeric | 500 | 0 |
| GICS Sector | Qualitative | Nonnumeric | 500 | 0 |
| S&P 100 | Qualitative | Nonnumeric | 500 | 0 |
Use this second tool to make a pie chart that graphically shows the relative frequencies of the S&P 100 companies according to their GICS sectors. (Hint: Before creating the pie chart, use the variable S&P 100 to filter out all the companies that are not in the S&P 100. To do this, click on one of the Variable sliding panels on the left side of the tool screen, and select the variable S&P 100. The second column shown is labeled Filter. To exclude companies that are not in the S&P 100, click to remove the X in the box next to the category Not in S&P 100. Then proceed by clicking on another of the Variable sliding panels, selecting the variable GICS Sector, and clicking on the Pie Chart button.)
What is the percent frequency of S&P 100 companies in the Financials sector?
18.0%
17.6%
11.0%
0.18%
According to GICS specifications, companies in the Consumer Discretionary sectorsuch as those in the leisure and entertainment industries, consumer retailing and services, or manufacture of household durable goodsare the most sensitive to economic cycles. Companies in the Consumer Staples sectorsuch as manufacturers and distributors of food, beverages, tobacco, and household nondurable goodsare less sensitive to economic cycles.
Compare the percent frequencies for the Consumer Discretionary and Consumer Staples sectors in the preceding two pie charts.
The percent frequency of S&P 100 companies in the Consumer Discretionary sector is the percent frequency of S&P 500 companies in the same sector. The percent frequency for S&P 100 companies in the Consumer Staples sector is the percent frequency of S&P 500 companies in the same sector. The percent frequency of S&P 100 companies in the combined sectors (Consumer Discretionary and Consumer Staples) is the percent frequency of S&P 500 companies in the two sectors.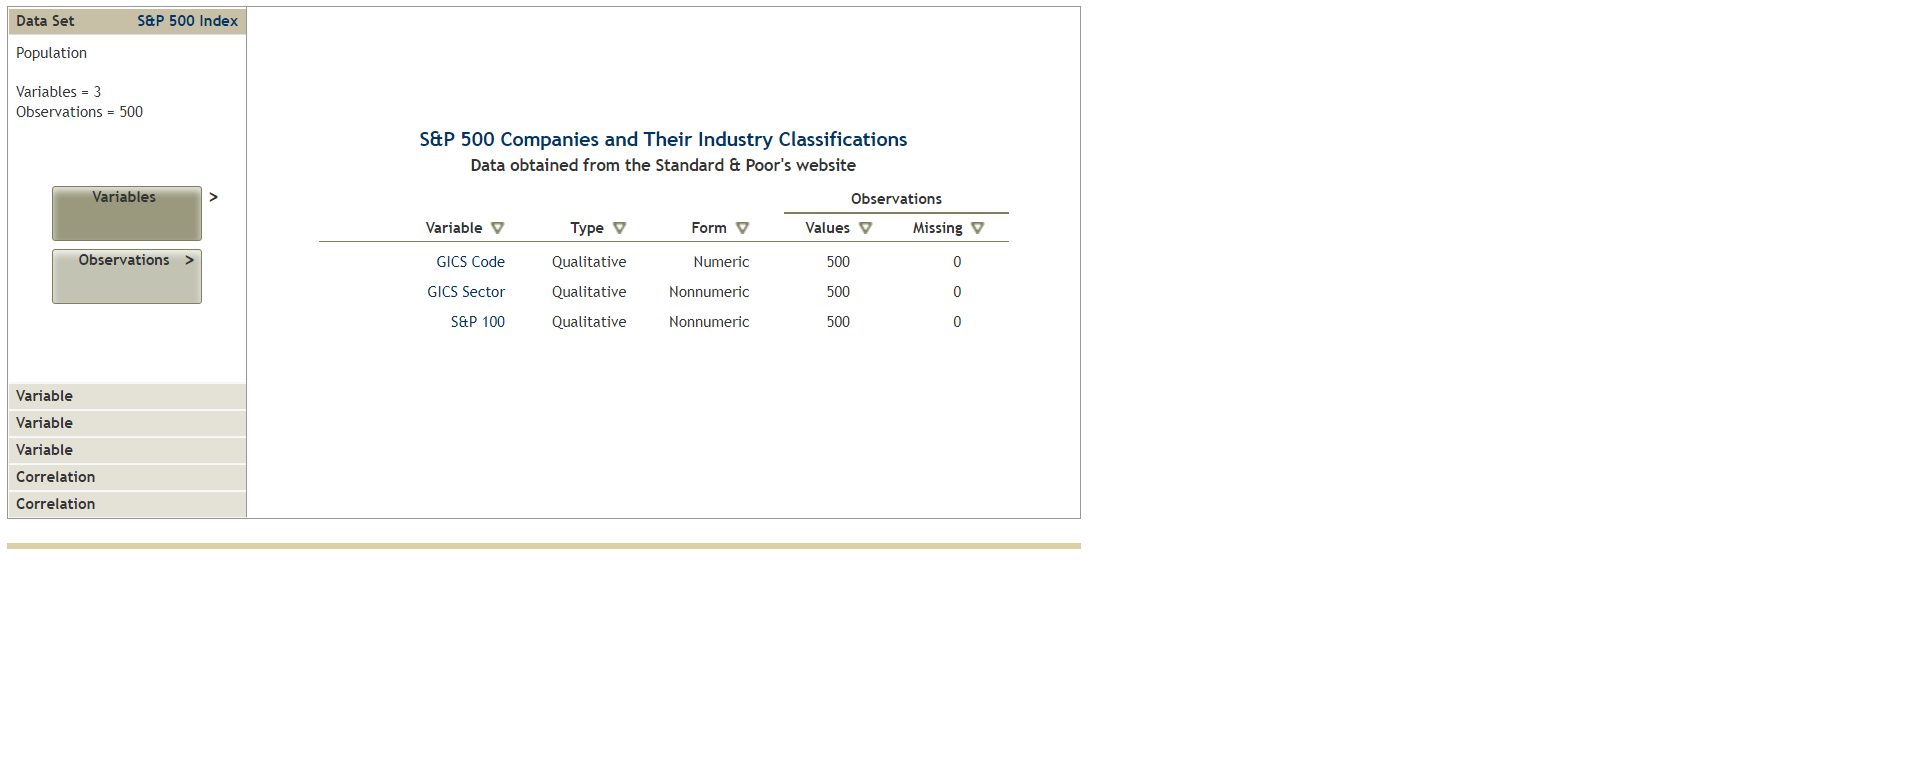
Data Set S&P 500 Index Population Variables = 3 Observations = 500 S&P 500 Companies and Their Industry Classifications Data obtained from the Standard & Poor's website Variables Observations Variable y Type V Formy Values v Missing Observations > GICS Code Qualitative Numeric 500 0 GICS Sector Qualitative Nonnumeric 500 0 S&P 100 Qualitative Nonnumeric 500 0 Variable Variable Variable Correlation Correlation Data Set S&P 500 Index Population Variables = 3 Observations = 500 S&P 500 Companies and Their Industry Classifications Data obtained from the Standard & Poor's website Variables Observations Variable y Type V Formy Values v Missing Observations > GICS Code Qualitative Numeric 500 0 GICS Sector Qualitative Nonnumeric 500 0 S&P 100 Qualitative Nonnumeric 500 0 Variable Variable Variable Correlation Correlation
Step by Step Solution
There are 3 Steps involved in it

Get step-by-step solutions from verified subject matter experts