

Question: 4. Suppose the graph below shows the demand for iPhones. The vertical intercept is indicated by Pi and the horizontal intercept is indicated by Q1.
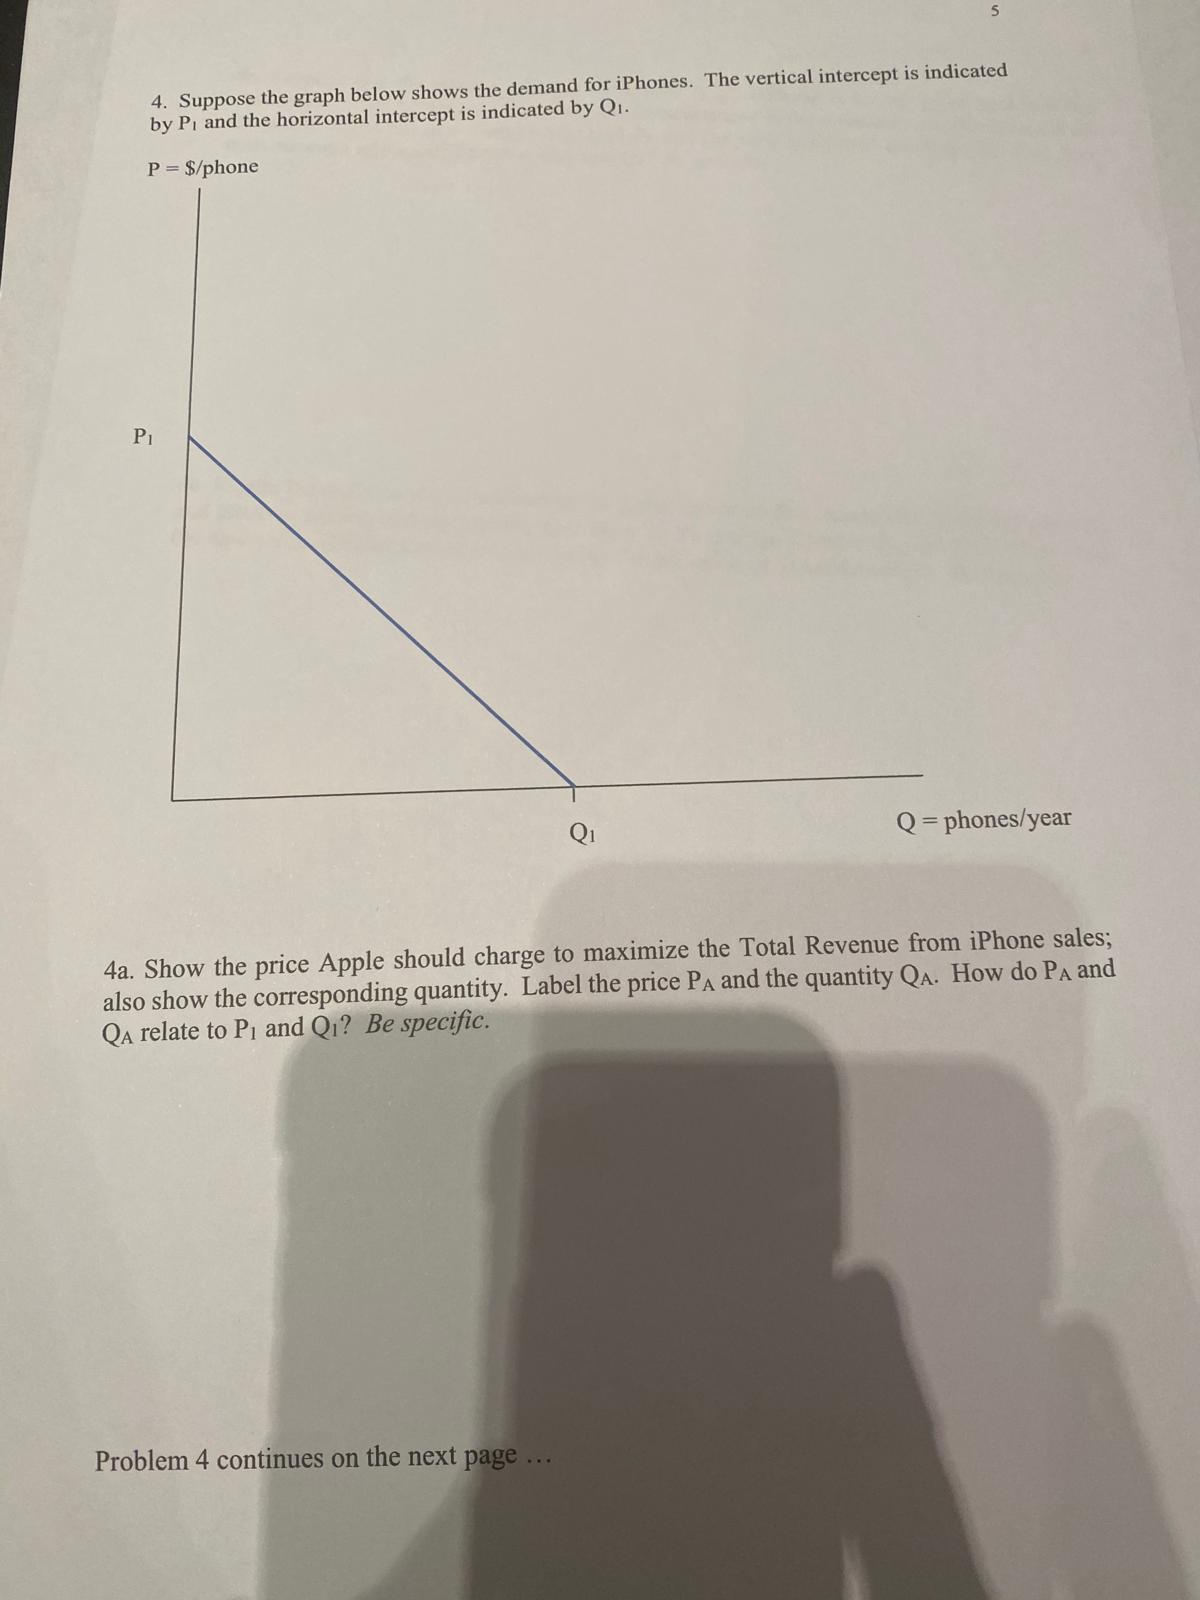
4. Suppose the graph below shows the demand for iPhones. The vertical intercept is indicated by Pi and the horizontal intercept is indicated by Q1. P = $/phone PI Q1 Q = phones/year 4a. Show the price Apple should charge to maximize the Total Revenue from iPhone sales; also show the corresponding quantity. Label the price PA and the quantity QA. How do PA and QA relate to P1 and Q1? Be specific. Problem 4 continues on the next page ...4b. Suppose that the income elasticity of iPhone is 2.5 (iPhone is luxury good) and that the consumers' incomes rise by 20%. Show the consequences of the consumer income increase on the graph. Label the new vertical intercept P2 and the new horizontal intercept Q2. Can you determine the relationship between Q2 and Qi? Be specific. 4c. Repeat the analysis you conducted in 4a. Label the price that maximizes Total Revenue PB and label the corresponding quantity QB. How do PB and QB relate to PA and QA? How does the new value of Total Revenue relate to the former value of Total Revenue? Be specific
Step by Step Solution
There are 3 Steps involved in it

Get step-by-step solutions from verified subject matter experts