

Question: 4) The CAL below describes possible allocations to two assets, one risky asset p and one riskfree asset, the T-bill. The orange dot (in the
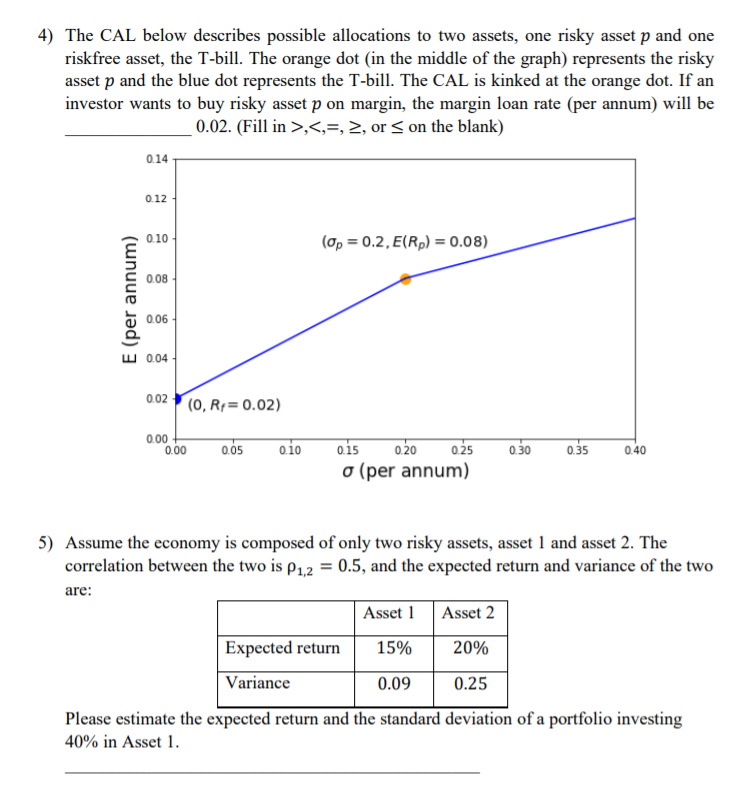
4) The CAL below describes possible allocations to two assets, one risky asset p and one riskfree asset, the T-bill. The orange dot (in the middle of the graph) represents the risky asset p and the blue dot represents the T-bill. The CAL is kinked at the orange dot. If an investor wants to buy risky asset p on margin, the margin loan rate (per annum) will be 0.02. (Fill in >,, 2, or on the blank) 0.14 0.12 0.10 (Op = 0.2, E(Rp) = 0.08) 0.08 E (per annum) 0.06 w 0.04 0.02 (0, Rp=0.02) 0.00 0.00 0.05 o.io 0.25 0.30 0.35 0.40 015 0.20 o (per annum) 5) Assume the economy is composed of only two risky assets, asset 1 and asset 2. The correlation between the two is P1,2 = 0.5, and the expected return and variance of the two are: Asset 1 Asset 2 Expected return 15% 20% Variance 0.09 0.25 Please estimate the expected return and the standard deviation of a portfolio investing 40% in Asset 1
Step by Step Solution
There are 3 Steps involved in it

Get step-by-step solutions from verified subject matter experts