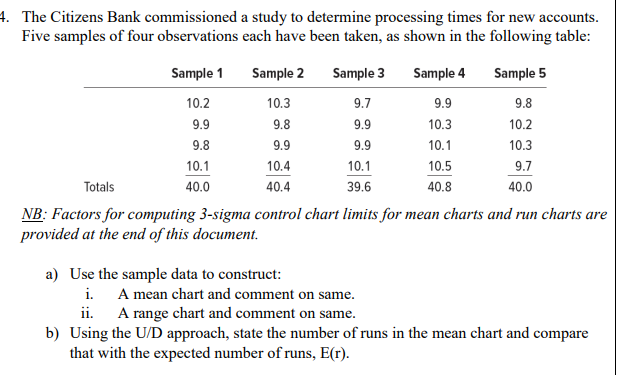
Question: 4. The Citizens Bank commissioned a study to determine processing times for new accounts. Five samples of four observations each have been taken, as


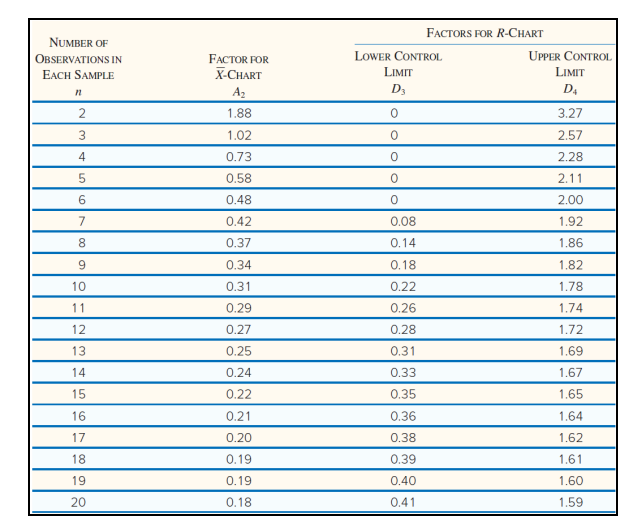
4. The Citizens Bank commissioned a study to determine processing times for new accounts. Five samples of four observations each have been taken, as shown in the following table: Totals Sample 1 Sample 2 Sample 3 Sample 4 Sample 5 10.2 10.3 9.7 9.9 9.8 9.9 9.8 9.9 10.3 10.2 9.8 9.9 9.9 10.1 10.3 10.1 10.4 10.1 10.5 9.7 40.0 40.4 39.6 40.8 40.0 NB: Factors for computing 3-sigma control chart limits for mean charts and run charts are provided at the end of this document. a) Use the sample data to construct: i. A mean chart and comment on same. ii. A range chart and comment on same. b) Using the U/D approach, state the number of runs in the mean chart and compare that with the expected number of runs, E(r). FACTORS FOR R-CHART NUMBER OF OBSERVATIONS IN EACH SAMPLE n FACTOR FOR X-CHART LOWER CONTROL UPPER CONTROL LIMIT LIMIT A2 D3 D4 2 1.88 0 3.27 3 1.02 0 2.57 4 0.73 0 2.28 5 0.58 0 2.11 6 0.48 0 2.00 7 0.42 0.08 1.92 8 0.37 0.14 1.86 9 0.34 0.18 1.82 10 0.31 0.22 1.78 11 0.29 0.26 1.74 12 0.27 0.28 1.72 13 0.25 0.31 1.69 14 0.24 0.33 1.67 15 0.22 0.35 1.65 16 0.21 0.36 1.64 17 0.20 0.38 1.62 18 0.19 0.39 1.61 19 0.19 0.40 1.60 20 0.18 0.41 1.59
Step by Step Solution
There are 3 Steps involved in it
To solve this problem we need to construct both a mean chart Xchart and a range chart Rchart using t... View full answer

Get step-by-step solutions from verified subject matter experts


