

Question: 4. The Excel file Stock Data contains monthly return data for five (5) stocks. a. Use these returns and the Matrix of Excess Returns to
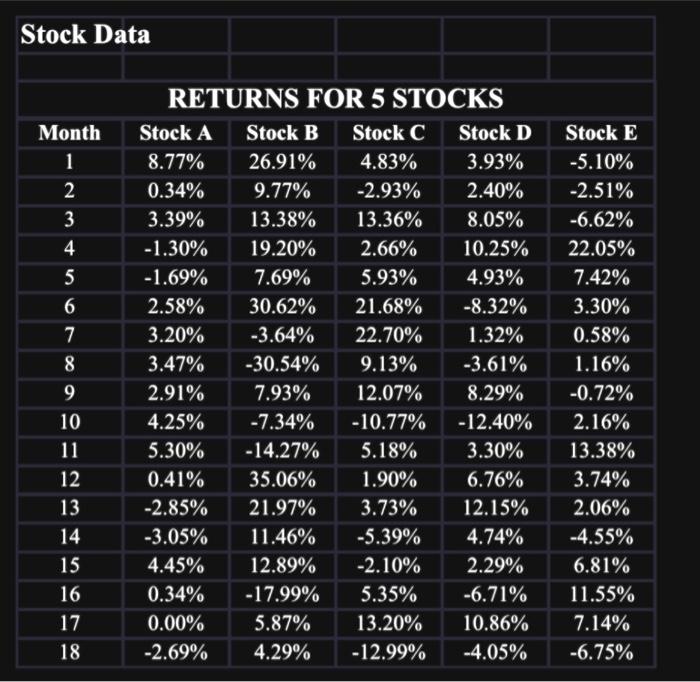
4. The Excel file Stock Data contains monthly return data for five (5) stocks. a. Use these returns and the Matrix of Excess Returns to compute the Variance-Covariance Matrix for these five (5) stocks. (Do not use the varcovar VBA function). b. Use the Variance - Covariance Matrix for these five (5) stocks to compute the individual stock proportions for the Global Minimum Variance Portfolio (GMVP). c. Calculate the Expected Return and Risk (Standard Deviation) for the Global Minimum Variance Portfolio (GMVP). Stock Data RETURNS FOR 5 STOCKS \begin{tabular}{|c|c|c|c|c|c|} \hline Month & Stock A & Stock B & Stock C & Stock D & Stock E \\ \hline 1 & 8.77% & 26.91% & 4.83% & 3.93% & 5.10% \\ \hline 2 & 0.34% & 9.77% & 2.93% & 2.40% & 2.51% \\ \hline 3 & 3.39% & 13.38% & 13.36% & 8.05% & 6.62% \\ \hline 4 & 1.30% & 19.20% & 2.66% & 10.25% & 22.05% \\ \hline 5 & 1.69% & 7.69% & 5.93% & 4.93% & 7.42% \\ \hline 6 & 2.58% & 30.62% & 21.68% & 8.32% & 3.30% \\ \hline 7 & 3.20% & 3.64% & 22.70% & 1.32% & 0.58% \\ \hline 8 & 3.47% & 30.54% & 9.13% & 3.61% & 1.16% \\ \hline 9 & 2.91% & 7.93% & 12.07% & 8.29% & 0.72% \\ \hline 10 & 4.25% & 7.34% & 10.77% & 12.40% & 2.16% \\ \hline 11 & 5.30% & 14.27% & 5.18% & 3.30% & 13.38% \\ \hline 12 & 0.41% & 35.06% & 1.90% & 6.76% & 3.74% \\ \hline 13 & 2.85% & 21.97% & 3.73% & 12.15% & 2.06% \\ \hline 14 & 3.05% & 11.46% & 5.39% & 4.74% & 4.55% \\ \hline 15 & 4.45% & 12.89% & 2.10% & 2.29% & 6.81% \\ \hline 16 & 0.34% & 17.99% & 5.35% & 6.71% & 11.55% \\ \hline 17 & 0.00% & 5.87% & 13.20% & 10.86% & 7.14% \\ \hline 18 & 2.69% & 4.29% & 12.99% & 4.05% & 6.75% \\ \hline \end{tabular} 4. The Excel file Stock Data contains monthly return data for five (5) stocks. a. Use these returns and the Matrix of Excess Returns to compute the Variance-Covariance Matrix for these five (5) stocks. (Do not use the varcovar VBA function). b. Use the Variance - Covariance Matrix for these five (5) stocks to compute the individual stock proportions for the Global Minimum Variance Portfolio (GMVP). c. Calculate the Expected Return and Risk (Standard Deviation) for the Global Minimum Variance Portfolio (GMVP). Stock Data RETURNS FOR 5 STOCKS \begin{tabular}{|c|c|c|c|c|c|} \hline Month & Stock A & Stock B & Stock C & Stock D & Stock E \\ \hline 1 & 8.77% & 26.91% & 4.83% & 3.93% & 5.10% \\ \hline 2 & 0.34% & 9.77% & 2.93% & 2.40% & 2.51% \\ \hline 3 & 3.39% & 13.38% & 13.36% & 8.05% & 6.62% \\ \hline 4 & 1.30% & 19.20% & 2.66% & 10.25% & 22.05% \\ \hline 5 & 1.69% & 7.69% & 5.93% & 4.93% & 7.42% \\ \hline 6 & 2.58% & 30.62% & 21.68% & 8.32% & 3.30% \\ \hline 7 & 3.20% & 3.64% & 22.70% & 1.32% & 0.58% \\ \hline 8 & 3.47% & 30.54% & 9.13% & 3.61% & 1.16% \\ \hline 9 & 2.91% & 7.93% & 12.07% & 8.29% & 0.72% \\ \hline 10 & 4.25% & 7.34% & 10.77% & 12.40% & 2.16% \\ \hline 11 & 5.30% & 14.27% & 5.18% & 3.30% & 13.38% \\ \hline 12 & 0.41% & 35.06% & 1.90% & 6.76% & 3.74% \\ \hline 13 & 2.85% & 21.97% & 3.73% & 12.15% & 2.06% \\ \hline 14 & 3.05% & 11.46% & 5.39% & 4.74% & 4.55% \\ \hline 15 & 4.45% & 12.89% & 2.10% & 2.29% & 6.81% \\ \hline 16 & 0.34% & 17.99% & 5.35% & 6.71% & 11.55% \\ \hline 17 & 0.00% & 5.87% & 13.20% & 10.86% & 7.14% \\ \hline 18 & 2.69% & 4.29% & 12.99% & 4.05% & 6.75% \\ \hline \end{tabular}
Step by Step Solution
There are 3 Steps involved in it

Get step-by-step solutions from verified subject matter experts