

Question: 4. The figure below represents the produc- tion function relating output to capital in the United States. Suppose unusual weather con- ditions result in a
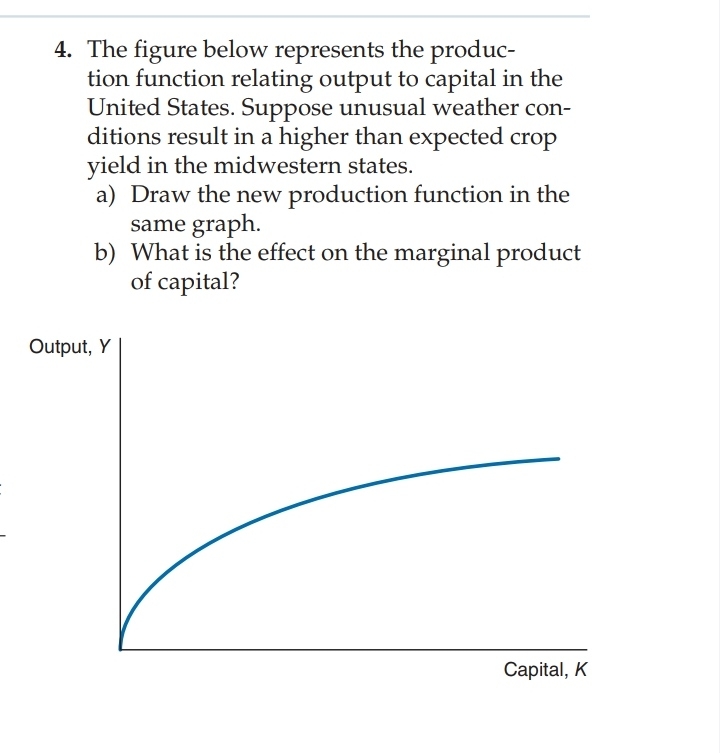
4. The figure below represents the produc-
tion function relating output to capital in the
United States. Suppose unusual weather con-
ditions result in a higher than expected crop
yield in the midwestern states.
a) Draw the new production function in the
same graph.
b) What is the effect on the marginal product
of capital?
4. The gure below represents the produc- tion function relating output to capital in the United States. Suppose unusual weather con- ditions result in a higher than expected crop yield in the rnidwestern states. a) Draw the new production function in the same graph. 13) What is the effect on the marginal product of capital? Output, Y Capital, K
Step by Step Solution
There are 3 Steps involved in it

Get step-by-step solutions from verified subject matter experts