

Question: 4. The graph displays a residual plot that was constructed after running a least-squares regression on a set of bivariate numerical data (x, y). (Please
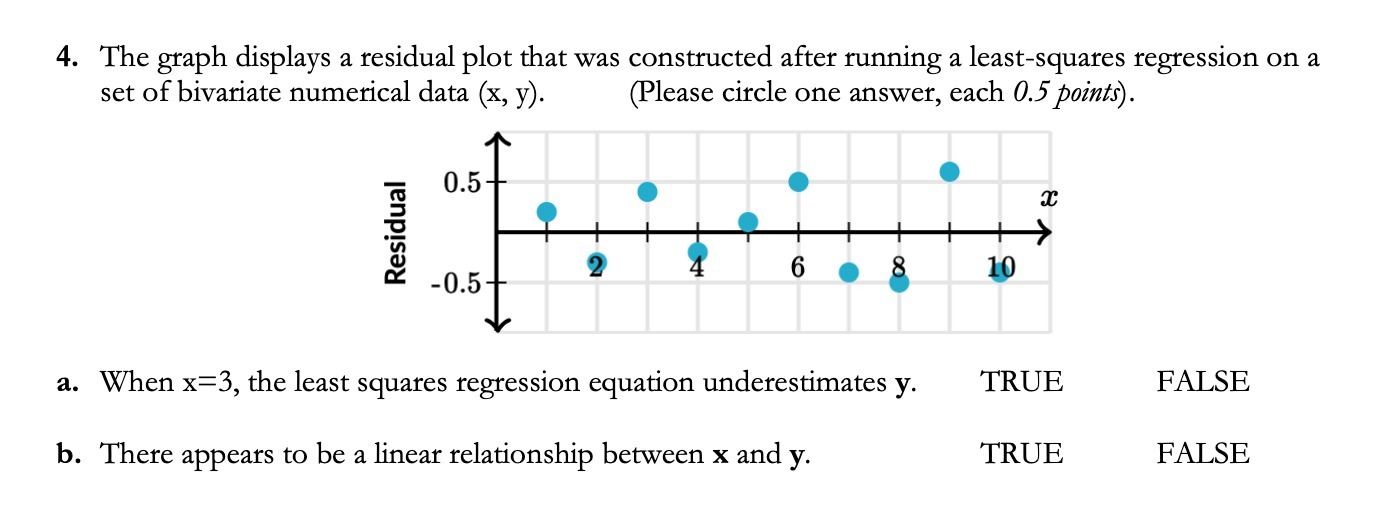
4. The graph displays a residual plot that was constructed after running a least-squares regression on a set of bivariate numerical data (x, y). (Please circle one answer, each 0.5pairm). Residual a. When x=3, the least squares regression equation underestimates y. TRUE FALSE b. There appears to be a linear relationship between x and y. TRUE FALSE
Step by Step Solution
There are 3 Steps involved in it
1 Expert Approved Answer
Step: 1 Unlock

Question Has Been Solved by an Expert!
Get step-by-step solutions from verified subject matter experts
Step: 2 Unlock
Step: 3 Unlock