

Question: 4. The graph of a function g is shown on the zy -plane on the interval [-7,7]. a. A table of selected values is
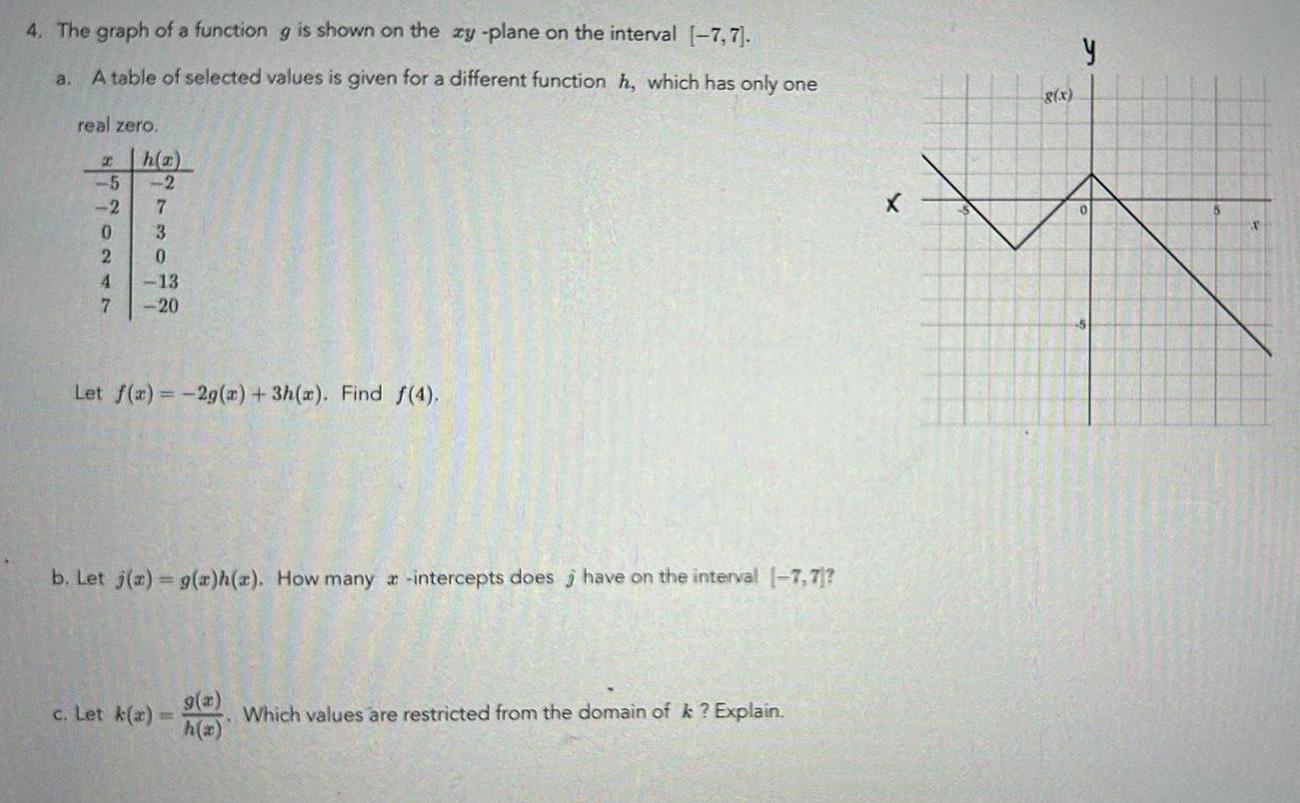
4. The graph of a function g is shown on the zy -plane on the interval [-7,7]. a. A table of selected values is given for a different function h, which has only one real zero. H h(z) -5 -2 -2 7 0 3 2 0 4 -13 7 -20 Let f(x)=-2g() + 3h(x). Find f(4). b. Let j(z) = g(a)h(z). How many a intercepts does j have on the interval (-7,7]? 9(2) c. Let k(z) Which values are restricted from the domain of k? Explain. h(2) x 8(x) y
Step by Step Solution
There are 3 Steps involved in it
1 Expert Approved Answer
Step: 1 Unlock

Question Has Been Solved by an Expert!
Get step-by-step solutions from verified subject matter experts
Step: 2 Unlock
Step: 3 Unlock