

Question: 4. The table below has four models relating the graduate students grade point average (GGPA) of 427 students to their college grade point av- erage
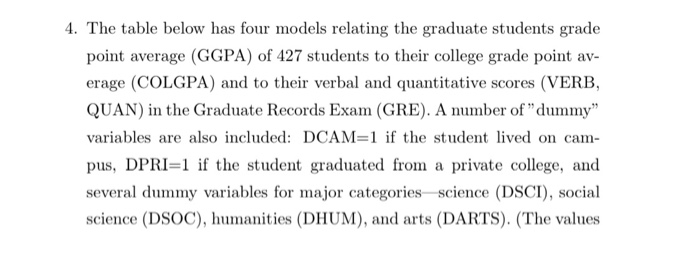
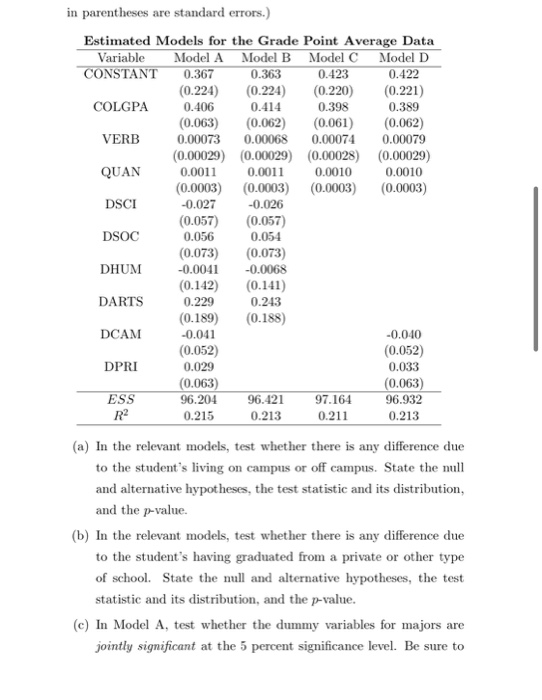
4. The table below has four models relating the graduate students grade point average (GGPA) of 427 students to their college grade point av- erage (COLGPA) and to their verbal and quantitative scores (VERB, QUAN) in the Graduate Records Exam (GRE). A number of "dummy" variables are also included: DCAM=1 if the student lived on cam- pus, DPRI=1 if the student graduated from a private college, and several dummy variables for major categories science (DSCI), social science (DSOC), humanities (DHUM), and arts (DARTS). (The values in parentheses are standard errors.) Estimated Models for the Grade Point Average Data Variable Model A Model B Model C Model D CONSTANT 0.367 0.363 0.423 0.422 (0.224) (0.224) (0.220) (0.221) COLGPA 0.406 0.414 0.398 0.389 (0.063) (0.062) (0.061) (0.062) VERB 0.00073 0.00068 0.00074 0.00079 (0.00029) (0.00029) (0.00028) (0.00029) QUAN 0.0011 0.0011 0.0010 0.0010 (0.0003) (0.0003) (0.0003) (0.0003) DSCI -0.027 -0.026 (0.057) (0.057) DSOC 0.056 0.054 (0.073) (0.073) DHUM -0.0041 -0.0068 (0.142) (0.141) DARTS 0.229 0.243 (0.189) (0.188) DCAM -0.041 -0.040 (0.052) (0.052) DPRI 0.029 0.033 (0.063) (0.063) ESS 96.204 96.421 97.164 96.932 R2 0.215 0.213 0.211 0.213 (a) In the relevant models, test whether there is any difference due to the student's living on campus or off campus. State the null and alternative hypotheses, the test statistic and its distribution, and the p-value (b) In the relevant models, test whether there is any difference due to the student's having graduated from a private or other type of school. State the null and alternative hypotheses, the test statistic and its distribution, and the p-value. (c) In Model A, test whether the dummy variables for majors are jointly significant at the 5 percent significance level. Be sure to state the null and alternative hypotheses, the test statistic and its distribution. Perform the same test with Model B as the unrestricted model. Do you get the same result? (d) In Model A, test the hypothesis that all of the dummy variables have zero regression coefficients
Step by Step Solution
There are 3 Steps involved in it

Get step-by-step solutions from verified subject matter experts