

Question: 4. The table below provides data about height and income among American men, taken from the National Longitudinal Survey. It is fine to use
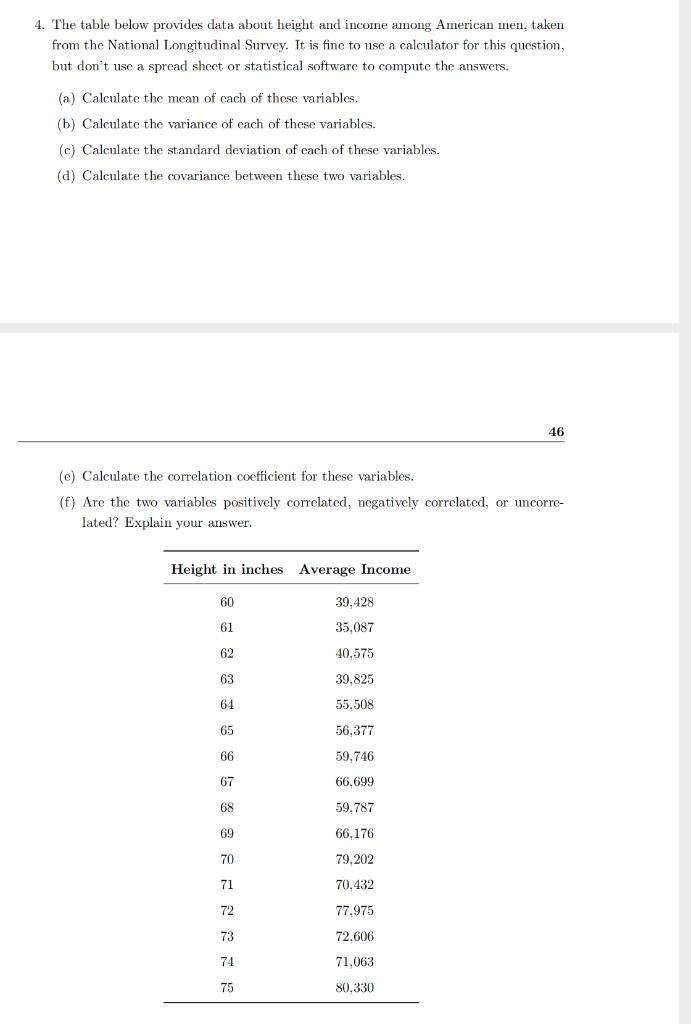
4. The table below provides data about height and income among American men, taken from the National Longitudinal Survey. It is fine to use a calculator for this question, but don't use a spread sheet or statistical software to compute the answers. (a) Calculate the mean of each of these variables. (b) Calculate the variance of each of these variables. (c) Calculate the standard deviation of each of these variables. (d) Calculate the covariance between these two variables. (e) Calculate the correlation coefficient for these variables. (f) Are the two variables positively correlated, negatively correlated, or uncorre- lated? Explain your answer. Height in inches Average Income 60 61 62 63 64 65 66 67 68 69 70 71 72 73 74 75 46 39,428 35,087 40,575 39,825 55,508 56,377 59,746 66.699 59,787 66,176 79,202 70,432 77.975 72,606 71,063 80.330
Step by Step Solution
3.35 Rating (164 Votes )
There are 3 Steps involved in it
To calculate the mean variance standard deviation covariance and correlation coefficient we need to organize the data in a table format Height in inch... View full answer

Get step-by-step solutions from verified subject matter experts