

Question: 4. This question refers to the proformas in Exhibit C of the 12 Step DCF class handout. For Company B in year 1, show how
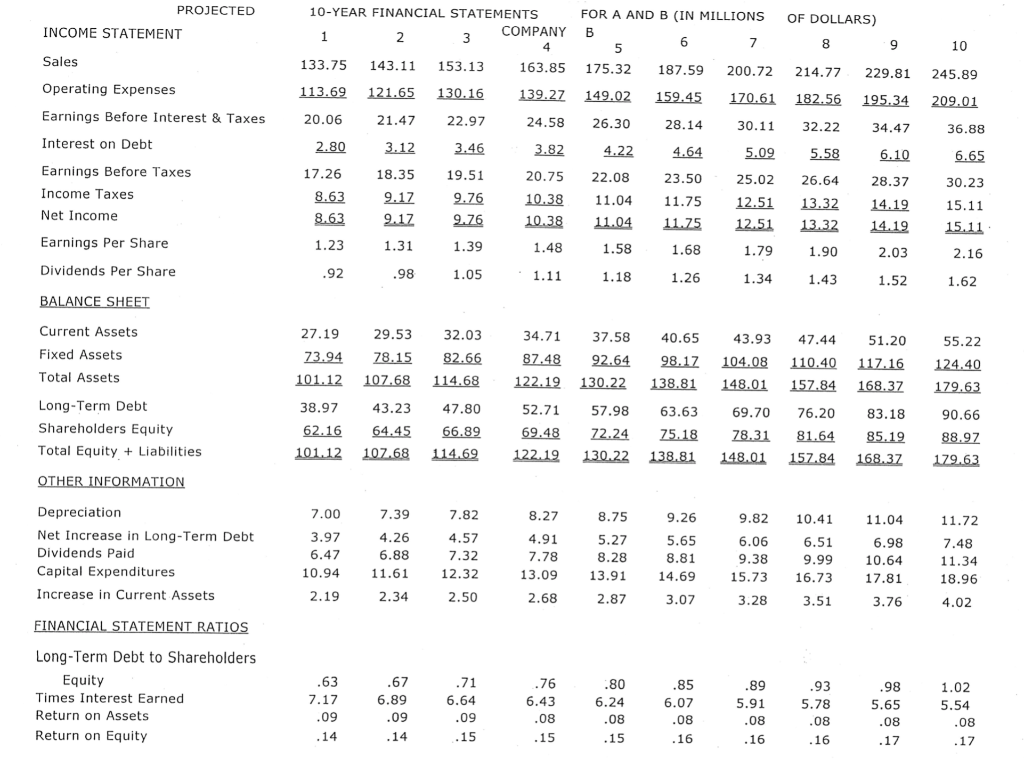
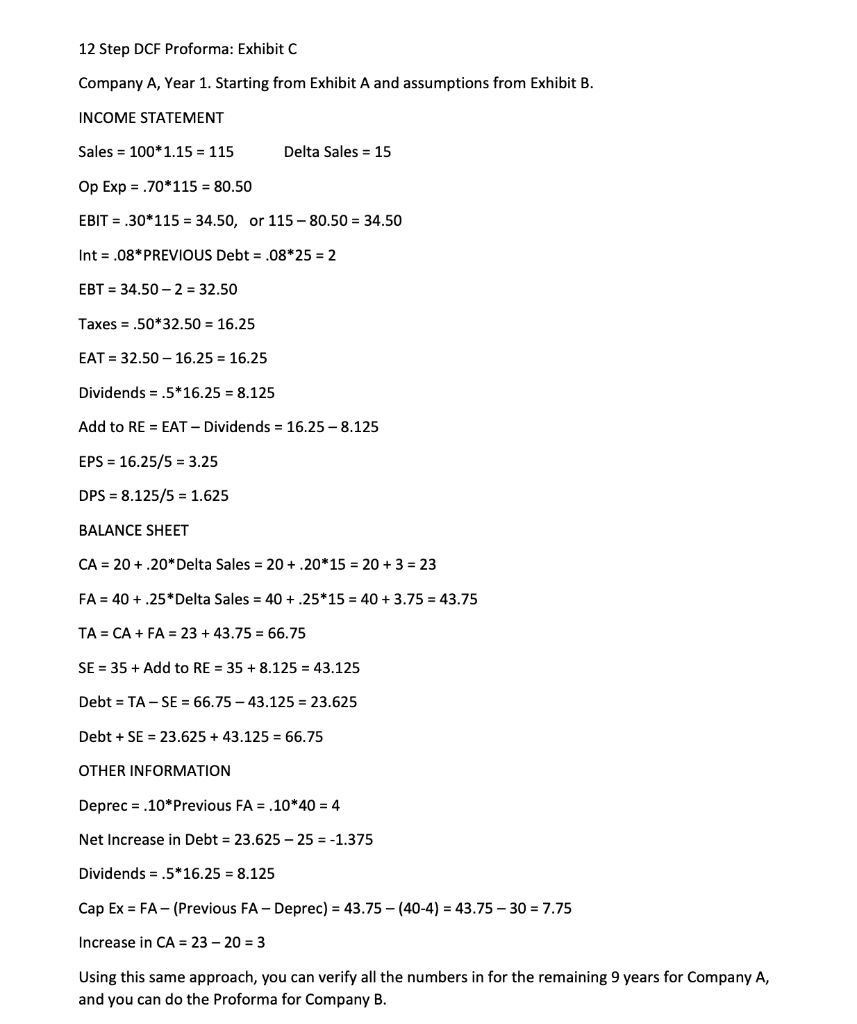
4. This question refers to the proformas in Exhibit C of the 12 Step DCF class handout. For Company B in year 1, show how all the values are derived in the Income Statement, Balance Sheet, and Other Information. Do this in the same way we did it in class for Company A's year 1. PROJECTED INCOME STATEMENT Sales Operating Expenses Earnings Before Interest & Taxes Interest on Debt 10-YEAR FINANCIAL STATEMENTS FOR A AND B (IN MILLIONS OF DOLLARS) 2 3 COMPANY B 5 78 9 133.75 143.11 153.13 163.85 175.32187.59 200.72 214.77 229.81 113.69 121.65 130.16 139.22 149.02 159.45 170.61 182.56 195.34 20.06 21.47 22.97 24.58 26.30 28.14 30.11 32.22 34.47 2.80 3.12 3.46 3.82 4.22 4 .64 5.09 5.58 6.10 17.26 18.35 19.51 20.75 22.08 23.50 25.02 25.02 26.64 28.37 8.63 9.17 9.76 10.38 11.04 11.75 12.51 13.32 14.19 8.63 9.17 9.76 10.38 11.04 11.75 12.51 13.32 14.19 1.23 1.31 1.39 1.48 1.58 1 .68 1.79 1.90 2.03 .92 .98 1.05 1.11 1.18 1.26 1.34 1.43 1.52 10 245.89 209.01 36.88 6.65 30.23 15.11 15.11 2.16 1.62 Earnings Before Taxes Income Taxes Net Income Earnings Per Share Dividends Per Share BALANCE SHEET Current Assets Fixed Assets Total Assets 27.19 73.94 101.12 38.97 62.16 101.12 29.53 78.15 107,68 43.23 64.45 102.68 32.03 82.66 114.68 47.80 66.89 114.69 34.71 87.48 122.19 52.71 69.48 122.19 37.58 92.64 130.22 57.98 72.24 130.22 40.654 3.93 98.17 104.08 138.81 148.01 63.63 69.70 75.18 78.31 138.81 148.01 47.44 110.40 157.84 76.20 81.64 157.84 51.20 117.16 168.37 83.18 85.19 168.37 55.22 124.40 179.63 90.66 8 8.97 179.63 Long-Term Debt Shareholders Equity Total Equity + Liabilities OTHER INFORMATION Depreciation Net Increase in Long-Term Debt Dividends Paid Capital Expenditures Increase in Current Assets 7.00 3.97 6.47 10.94 2.19 7.397.82 4.26 4.57 6.88 7.32 11.61 12.32 2.34 2.50 8.27 4.91 7.78 13.09 2.68 8.75 5.27 8.28 13.91 2.87 9.26 5.65 8.81 14.69 3.07 9.82 6.06 9.38 15.73 3.28 10.41 6.51 9.99 16.73 3.51 11.04 6.98 10.64 17.81 3.76 11.72 7.48 11.34 18.96 4.02 FINANCIAL STATEMENT RATIOS .63 .67 .71 .76 80 1.02 Long-Term Debt to Shareholders Equity Times Interest Earned Return on Assets Return on Equity .98 5.65 6.89 6.64 6.24 7.17 .09 .14 .85 6.07 .08 16 .89 5.91 .08 16 6.43 .08 15 .93 5.78 .08 16 .09 .09 .08 .08 5.54 .08 17 14 15 15 17 12 Step DCF Proforma: Exhibit C Company A, Year 1. Starting from Exhibit A and assumptions from Exhibit B. INCOME STATEMENT Sales = 100*1.15 = 115 Delta Sales = 15 Op Exp = .70*115 = 80.50 EBIT = .30*115 = 34.50, or 115 - 80.50 = 34.50 Int = .08* PREVIOUS Debt = .08*25 = 2 EBT = 34.50 -2 = 32.50 Taxes = .50*32.50 = 16.25 EAT = 32.50 - 16.25 = 16.25 Dividends = .5*16.25 = 8.125 Add to RE = EAT - Dividends = 16.25 - 8.125 EPS = 16.25/5 = 3.25 DPS = 8.125/5 = 1.625 BALANCE SHEET CA = 20+.20* Delta Sales = 20 +.20*15 = 20 + 3 = 23 FA = 40 +.25*Delta Sales = 40 +.25*15 = 40 +3.75 = 43.75 TA = CA + FA = 23 + 43.75 = 66.75 SE = 35+ Add to RE = 35 + 8.125 = 43.125 Debt = TA-SE = 66.75 -43.125 = 23.625 Debt + SE = 23.625 + 43.125 = 66.75 OTHER INFORMATION Deprec = .10* Previous FA = .10*40 = 4 Net Increase in Debt = 23.625 - 25 = -1.375 Dividends = .5*16.25 = 8.125 Cap Ex = FA - (Previous FA - Deprec) = 43.75 -(40-4) = 43.75 -30 = 7.75 Increase in CA = 23 - 20 = 3 Using this same approach, you can verify all the numbers in for the remaining 9 years for Company A, and you can do the Proforma for Company B. 4. This question refers to the proformas in Exhibit C of the 12 Step DCF class handout. For Company B in year 1, show how all the values are derived in the Income Statement, Balance Sheet, and Other Information. Do this in the same way we did it in class for Company A's year 1. PROJECTED INCOME STATEMENT Sales Operating Expenses Earnings Before Interest & Taxes Interest on Debt 10-YEAR FINANCIAL STATEMENTS FOR A AND B (IN MILLIONS OF DOLLARS) 2 3 COMPANY B 5 78 9 133.75 143.11 153.13 163.85 175.32187.59 200.72 214.77 229.81 113.69 121.65 130.16 139.22 149.02 159.45 170.61 182.56 195.34 20.06 21.47 22.97 24.58 26.30 28.14 30.11 32.22 34.47 2.80 3.12 3.46 3.82 4.22 4 .64 5.09 5.58 6.10 17.26 18.35 19.51 20.75 22.08 23.50 25.02 25.02 26.64 28.37 8.63 9.17 9.76 10.38 11.04 11.75 12.51 13.32 14.19 8.63 9.17 9.76 10.38 11.04 11.75 12.51 13.32 14.19 1.23 1.31 1.39 1.48 1.58 1 .68 1.79 1.90 2.03 .92 .98 1.05 1.11 1.18 1.26 1.34 1.43 1.52 10 245.89 209.01 36.88 6.65 30.23 15.11 15.11 2.16 1.62 Earnings Before Taxes Income Taxes Net Income Earnings Per Share Dividends Per Share BALANCE SHEET Current Assets Fixed Assets Total Assets 27.19 73.94 101.12 38.97 62.16 101.12 29.53 78.15 107,68 43.23 64.45 102.68 32.03 82.66 114.68 47.80 66.89 114.69 34.71 87.48 122.19 52.71 69.48 122.19 37.58 92.64 130.22 57.98 72.24 130.22 40.654 3.93 98.17 104.08 138.81 148.01 63.63 69.70 75.18 78.31 138.81 148.01 47.44 110.40 157.84 76.20 81.64 157.84 51.20 117.16 168.37 83.18 85.19 168.37 55.22 124.40 179.63 90.66 8 8.97 179.63 Long-Term Debt Shareholders Equity Total Equity + Liabilities OTHER INFORMATION Depreciation Net Increase in Long-Term Debt Dividends Paid Capital Expenditures Increase in Current Assets 7.00 3.97 6.47 10.94 2.19 7.397.82 4.26 4.57 6.88 7.32 11.61 12.32 2.34 2.50 8.27 4.91 7.78 13.09 2.68 8.75 5.27 8.28 13.91 2.87 9.26 5.65 8.81 14.69 3.07 9.82 6.06 9.38 15.73 3.28 10.41 6.51 9.99 16.73 3.51 11.04 6.98 10.64 17.81 3.76 11.72 7.48 11.34 18.96 4.02 FINANCIAL STATEMENT RATIOS .63 .67 .71 .76 80 1.02 Long-Term Debt to Shareholders Equity Times Interest Earned Return on Assets Return on Equity .98 5.65 6.89 6.64 6.24 7.17 .09 .14 .85 6.07 .08 16 .89 5.91 .08 16 6.43 .08 15 .93 5.78 .08 16 .09 .09 .08 .08 5.54 .08 17 14 15 15 17 12 Step DCF Proforma: Exhibit C Company A, Year 1. Starting from Exhibit A and assumptions from Exhibit B. INCOME STATEMENT Sales = 100*1.15 = 115 Delta Sales = 15 Op Exp = .70*115 = 80.50 EBIT = .30*115 = 34.50, or 115 - 80.50 = 34.50 Int = .08* PREVIOUS Debt = .08*25 = 2 EBT = 34.50 -2 = 32.50 Taxes = .50*32.50 = 16.25 EAT = 32.50 - 16.25 = 16.25 Dividends = .5*16.25 = 8.125 Add to RE = EAT - Dividends = 16.25 - 8.125 EPS = 16.25/5 = 3.25 DPS = 8.125/5 = 1.625 BALANCE SHEET CA = 20+.20* Delta Sales = 20 +.20*15 = 20 + 3 = 23 FA = 40 +.25*Delta Sales = 40 +.25*15 = 40 +3.75 = 43.75 TA = CA + FA = 23 + 43.75 = 66.75 SE = 35+ Add to RE = 35 + 8.125 = 43.125 Debt = TA-SE = 66.75 -43.125 = 23.625 Debt + SE = 23.625 + 43.125 = 66.75 OTHER INFORMATION Deprec = .10* Previous FA = .10*40 = 4 Net Increase in Debt = 23.625 - 25 = -1.375 Dividends = .5*16.25 = 8.125 Cap Ex = FA - (Previous FA - Deprec) = 43.75 -(40-4) = 43.75 -30 = 7.75 Increase in CA = 23 - 20 = 3 Using this same approach, you can verify all the numbers in for the remaining 9 years for Company A, and you can do the Proforma for Company B
Step by Step Solution
There are 3 Steps involved in it

Get step-by-step solutions from verified subject matter experts