

Question: 4. This simulation exercise should be done using R. (a) Generate n = 100 observations from the model Yi =at BXi+Vi. where a = 1,
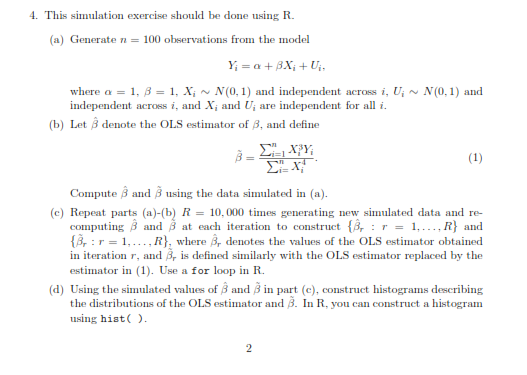
4. This simulation exercise should be done using R. (a) Generate n = 100 observations from the model Yi =at BXi+Vi. where a = 1, 8 = 1, Xi ~ N(0, 1) and independent across i, Uj ~ N(0, 1) and independent across i, and X, and U; are independent for all i. (b) Let A denote the OLS estimator of 8, and define (1) Compute # and # using the data simulated in (a). (c) Repeat parts (a)-(b) R = 10,000 times generating new simulated data and re- computing # and # at each iteration to construct {8, : r = 1, .... R} and (8, : r = 1,..., R), where &, denotes the values of the OLS estimator obtained in iteration r, and 8, is defined similarly with the OLS estimator replaced by the estimator in (1). Use a for loop in R. (d) Using the simulated values of B and # in part (c), construct histograms describing the distributions of the OLS estimator and 8. In R. you can construct a histogram using hist ( ). 2
Step by Step Solution
There are 3 Steps involved in it

Get step-by-step solutions from verified subject matter experts