

Question: 4 . Total economic surplus The following graph plots the supply and demand curves in the market for polaroid cameras. Use the black point (plus
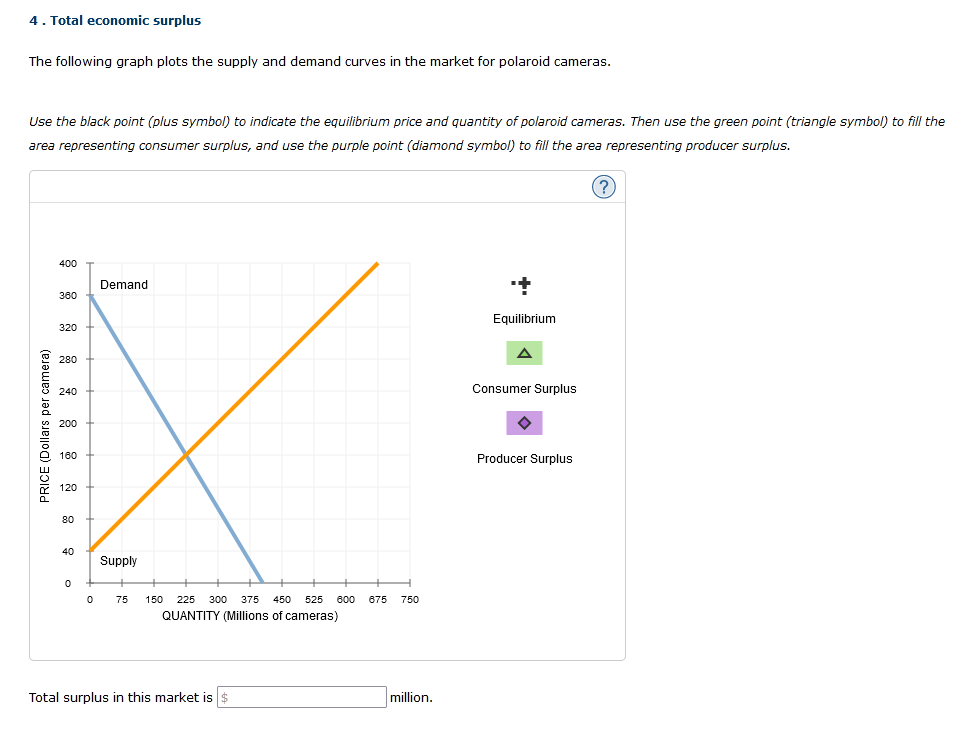
4 . Total economic surplus The following graph plots the supply and demand curves in the market for polaroid cameras. Use the black point (plus symbol) to indicate the equilibrium price and quantity of polaroid cameras. Then use the green point (triangle symbol) to fill the area representing consumer surplus, and use the purple point (diamond symbol) to fill the area representing producer surplus. 400 Demand 280 Equilibrium 320 A 280 Consumer Surplus 240 200 PRICE (Dollars per camera) 180 Producer Surplus 120 80 40 Supply 75 150 225 300 375 450 525 600 675 750 QUANTITY (Millions of cameras) Total surplus in this market is $ million
Step by Step Solution
There are 3 Steps involved in it
1 Expert Approved Answer
Step: 1 Unlock

Question Has Been Solved by an Expert!
Get step-by-step solutions from verified subject matter experts
Step: 2 Unlock
Step: 3 Unlock