

Question: 4. (Two marks for this question. Consider two bonds, A and B. Bond A is a 5- year 2% annual-coupon bond, and Bond B is
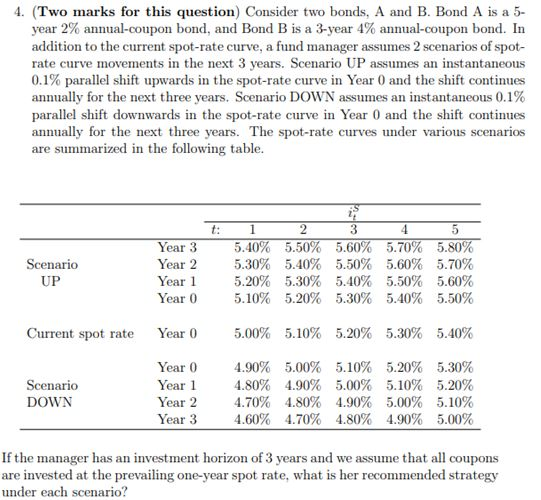
4. (Two marks for this question. Consider two bonds, A and B. Bond A is a 5- year 2% annual-coupon bond, and Bond B is a 3-year 4% annual-coupon bond. In addition to the current spot-rate curve, a fund manager assumes 2 scenarios of spot- rate curve movements in the next 3 years. Scenario UP assumes an instantaneous 0.1% parallel shift upwards in the spot-rate curve in Year 0 and the shift continues annually for the next three years. Scenario DOWN assumes an instantaneous 0.1% parallel shift downwards in the spot-rate curve in Year 0 and the shift continues annually for the next three years. The spot-rate curves under various scenarios are summarized in the following table. t: Scenario 1 5.40% 5.30% 5.20% 5.10% Year 3 Year 2 Year 1 Year 0 2 5.50% 5.40% 5.30% 5.20% 3 5.60% 5.50% 5.40% 5.30% 4 5.70% 5.60% 5.50% 5.40% 5 5.80% 5.70% 5.60% 5.50% UP Current spot rate Year 0 5.00% 5.10% 5.20% 5.30% 5.40% Scenario DOWN Year 0 Year 1 Year 2 Year 3 4.90% 4.80% 4.70% 4.60% 5.00% 4.90% 4.80% 4.70% 5.10% 5.00% 4.90% 4.80% 5.20% 5.10% 5.00% 4.90% 5.30% 5.20% 5.10% 5.00% If the manager has an investment horizon of 3 years and we assume that all coupons are invested at the prevailing one-year spot rate, what is her recommended strategy under each scenario? 4. (Two marks for this question. Consider two bonds, A and B. Bond A is a 5- year 2% annual-coupon bond, and Bond B is a 3-year 4% annual-coupon bond. In addition to the current spot-rate curve, a fund manager assumes 2 scenarios of spot- rate curve movements in the next 3 years. Scenario UP assumes an instantaneous 0.1% parallel shift upwards in the spot-rate curve in Year 0 and the shift continues annually for the next three years. Scenario DOWN assumes an instantaneous 0.1% parallel shift downwards in the spot-rate curve in Year 0 and the shift continues annually for the next three years. The spot-rate curves under various scenarios are summarized in the following table. t: Scenario 1 5.40% 5.30% 5.20% 5.10% Year 3 Year 2 Year 1 Year 0 2 5.50% 5.40% 5.30% 5.20% 3 5.60% 5.50% 5.40% 5.30% 4 5.70% 5.60% 5.50% 5.40% 5 5.80% 5.70% 5.60% 5.50% UP Current spot rate Year 0 5.00% 5.10% 5.20% 5.30% 5.40% Scenario DOWN Year 0 Year 1 Year 2 Year 3 4.90% 4.80% 4.70% 4.60% 5.00% 4.90% 4.80% 4.70% 5.10% 5.00% 4.90% 4.80% 5.20% 5.10% 5.00% 4.90% 5.30% 5.20% 5.10% 5.00% If the manager has an investment horizon of 3 years and we assume that all coupons are invested at the prevailing one-year spot rate, what is her recommended strategy under each scenario
Step by Step Solution
There are 3 Steps involved in it

Get step-by-step solutions from verified subject matter experts