

Question: 4.) Use the data in the table below to find the stock that is most likely to be undervalued. (Hint: Have to make sure the
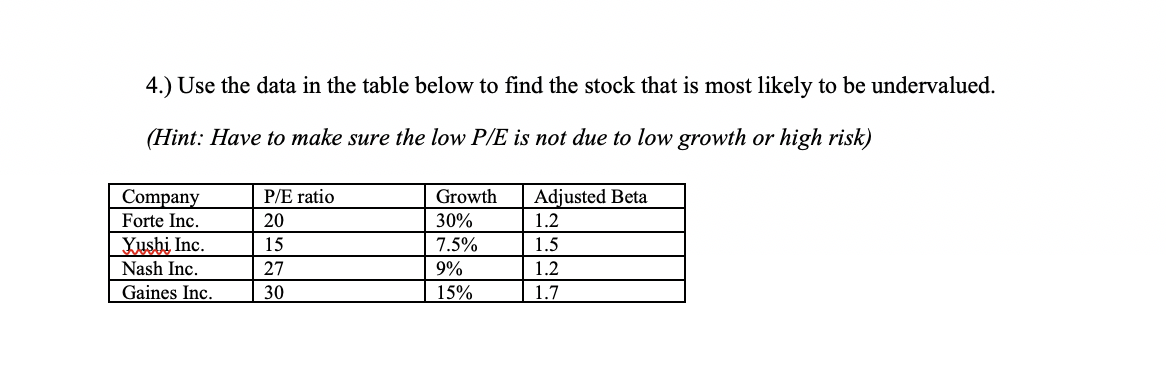
4.) Use the data in the table below to find the stock that is most likely to be undervalued. (Hint: Have to make sure the low P/E is not due to low growth or high risk) Company Forte Inc. Yushi Inc. Nash Inc. Gaines Inc. P/E ratio 20 15 27 30 Growth 30% 7.5% | 9% 15% Adjusted Beta 1.2 1.5 1.2 1.7
Step by Step Solution
There are 3 Steps involved in it
1 Expert Approved Answer
Step: 1 Unlock

Question Has Been Solved by an Expert!
Get step-by-step solutions from verified subject matter experts
Step: 2 Unlock
Step: 3 Unlock