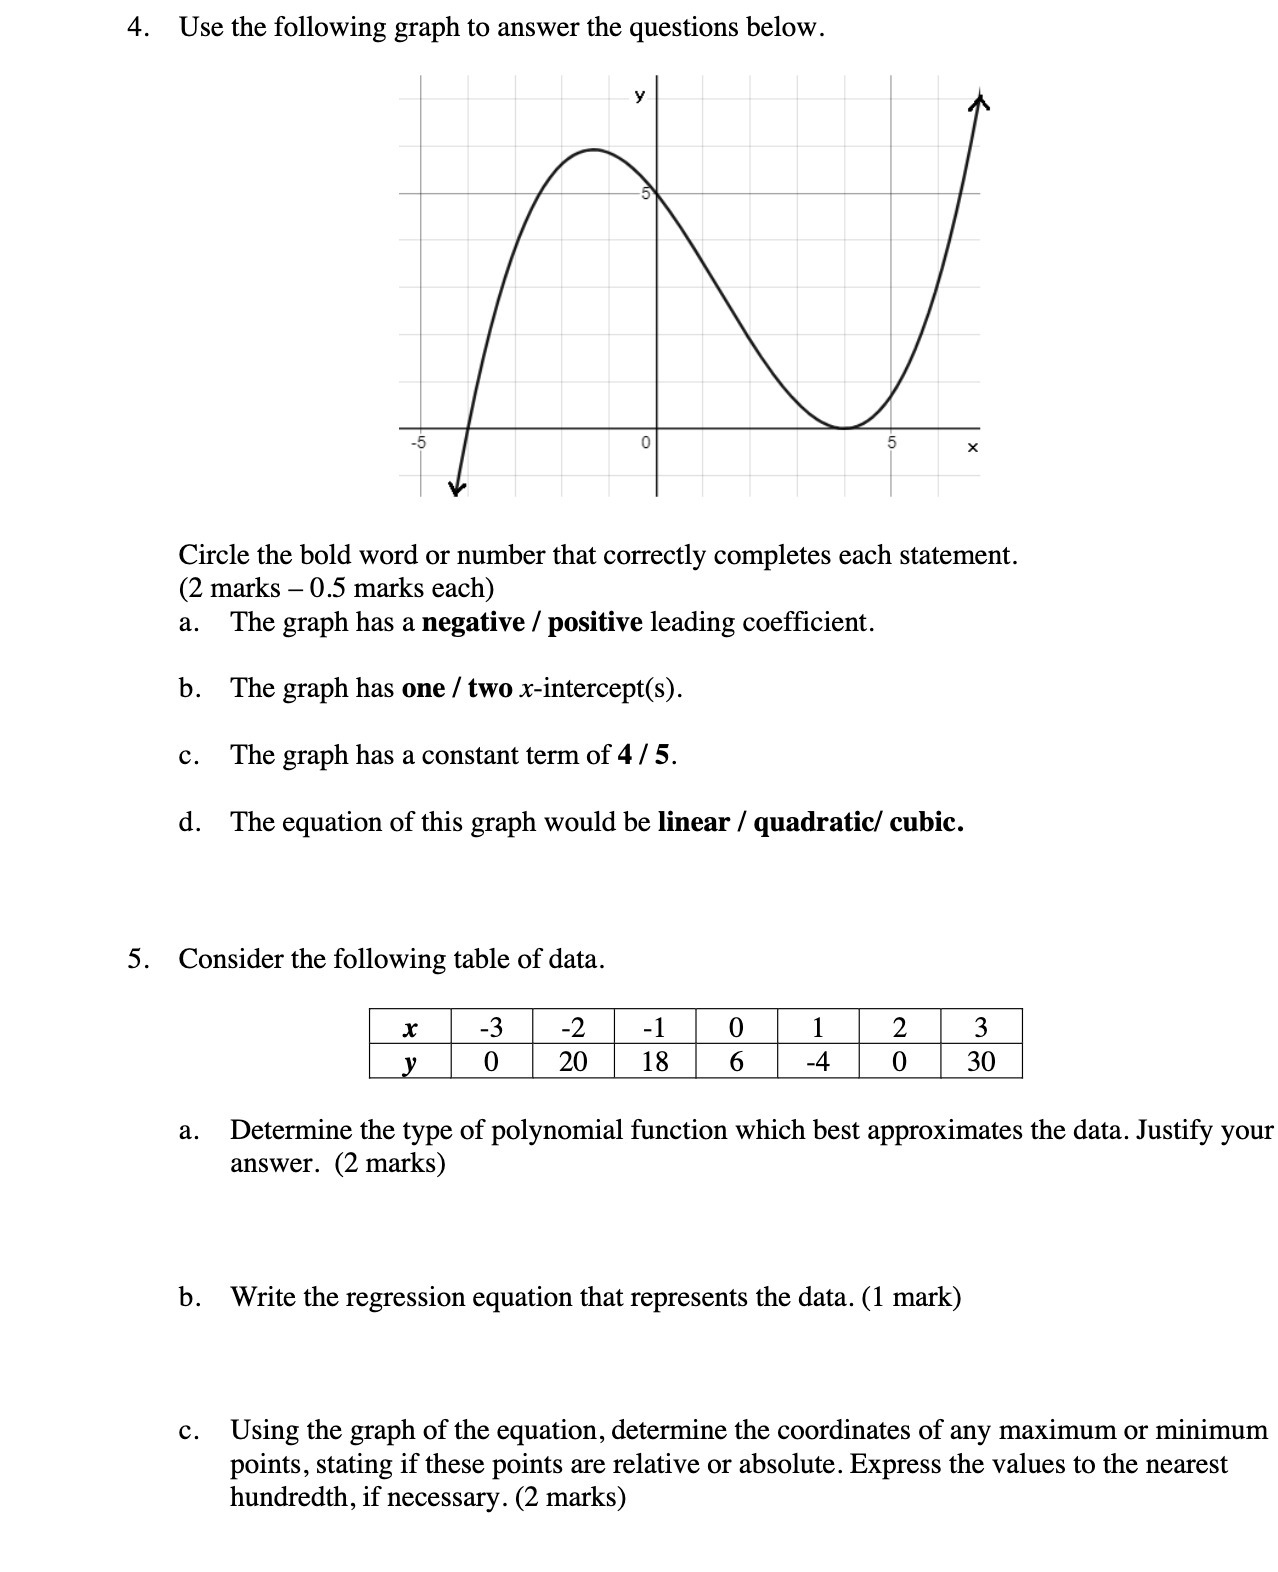
Question: 4. Use the following graph to answer the questions below. Circle the bold word or number that correctly completes each statement. (2 marks 0.5 marks

4. Use the following graph to answer the
4. Use the following graph to answer the questions below. Circle the bold word or number that correctly completes each statement. (2 marks 0.5 marks each) a. The graph has a negative I positive leading coefcient. b. The graph has one / two x-intercept(s). c. The graph has a constant term of 4 l 5. d. The equation of this graph would be linear / quadratic! cubic. 5. Consider the following table of data. lx3 -2\\10[123l 0 2018 6 -4 0 30 a. Determine the type of polynomial function which best approximates the data. Justify your answer. (2 marks) b. Write the regression equation that represents the data. (1 mark) 0. Using the graph of the equation, determine the coordinates of any maximum or minimum points, stating if these points are relative or absolute. Express the values to the nearest hundredth, if necessary. (2 marks)

Step by Step Solution

There are 3 Steps involved in it

1 Expert Approved Answer
Step: 1 Unlock blur-text-image
Question Has Been Solved by an Expert!

Get step-by-step solutions from verified subject matter experts

Step: 2 Unlock
Step: 3 Unlock

Students Have Also Explored These Related Mathematics Questions!