

Question: 4. Use the table for the question(s) below. Consider the following Price and Dividend data for J. P. Morgan Chase: Date Price (S) Dividend (S)
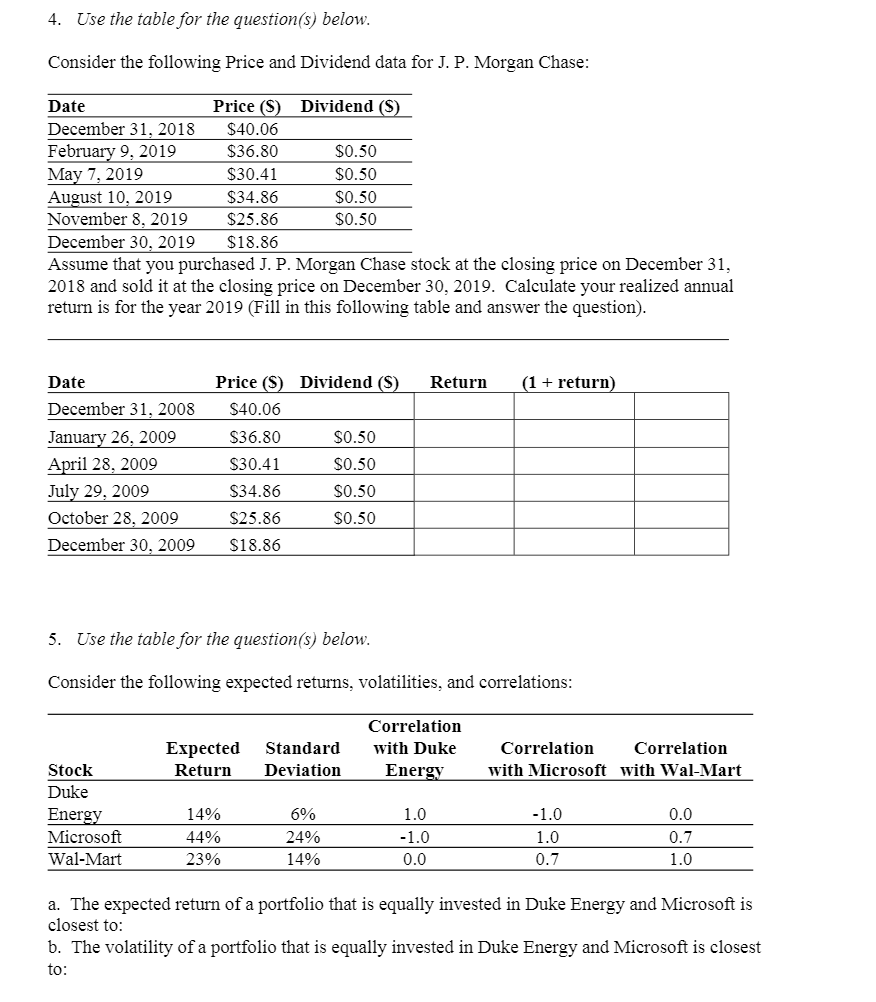
4. Use the table for the question(s) below. Consider the following Price and Dividend data for J. P. Morgan Chase: Date Price (S) Dividend (S) December 31, 2018 $40.06 February 9, 2019 $36.80 $0.50 May 7, 2019 $30.41 $0.50 August 10, 2019 $34.86 $0.50 November 8, 2019 $25.86 $0.50 December 30, 2019 $18.86 Assume that you purchased J. P. Morgan Chase stock the closing price on December 31, 2018 and sold it at the closing price on December 30, 2019. Calculate your realized annual return is for the year 2019 (Fill in this following table and answer the question). Date Return (1 + return) December 31, 2008 January 26, 2009 April 28, 2009 July 29, 2009 October 28, 2009 December 30, 2009 Price (S) Dividend (S) $40.06 $36.80 $0.50 $30.41 $0.50 $34.86 $0.50 $25.86 $0.50 $18.86 5. Use the table for the question(s) below. Consider the following expected returns, volatilities, and correlations: Expected Return Standard Deviation Correlation with Duke Energy Correlation Correlation with Microsoft with Wal-Mart Stock Duke Energy Microsoft Wal-Mart 14% 44% 23% 6% 24% 14% 1.0 -1.0 0.0 -1.0 1.0 0.7 0.0 0.7 1.0 a. The expected return of a portfolio that is equally invested in Duke Energy and Microsoft is closest to: b. The volatility of a portfolio that is equally invested in Duke Energy and Microsoft is closest to: 4. Use the table for the question(s) below. Consider the following Price and Dividend data for J. P. Morgan Chase: Date Price (S) Dividend (S) December 31, 2018 $40.06 February 9, 2019 $36.80 $0.50 May 7, 2019 $30.41 $0.50 August 10, 2019 $34.86 $0.50 November 8, 2019 $25.86 $0.50 December 30, 2019 $18.86 Assume that you purchased J. P. Morgan Chase stock the closing price on December 31, 2018 and sold it at the closing price on December 30, 2019. Calculate your realized annual return is for the year 2019 (Fill in this following table and answer the question). Date Return (1 + return) December 31, 2008 January 26, 2009 April 28, 2009 July 29, 2009 October 28, 2009 December 30, 2009 Price (S) Dividend (S) $40.06 $36.80 $0.50 $30.41 $0.50 $34.86 $0.50 $25.86 $0.50 $18.86 5. Use the table for the question(s) below. Consider the following expected returns, volatilities, and correlations: Expected Return Standard Deviation Correlation with Duke Energy Correlation Correlation with Microsoft with Wal-Mart Stock Duke Energy Microsoft Wal-Mart 14% 44% 23% 6% 24% 14% 1.0 -1.0 0.0 -1.0 1.0 0.7 0.0 0.7 1.0 a. The expected return of a portfolio that is equally invested in Duke Energy and Microsoft is closest to: b. The volatility of a portfolio that is equally invested in Duke Energy and Microsoft is closest to
Step by Step Solution
There are 3 Steps involved in it

Get step-by-step solutions from verified subject matter experts