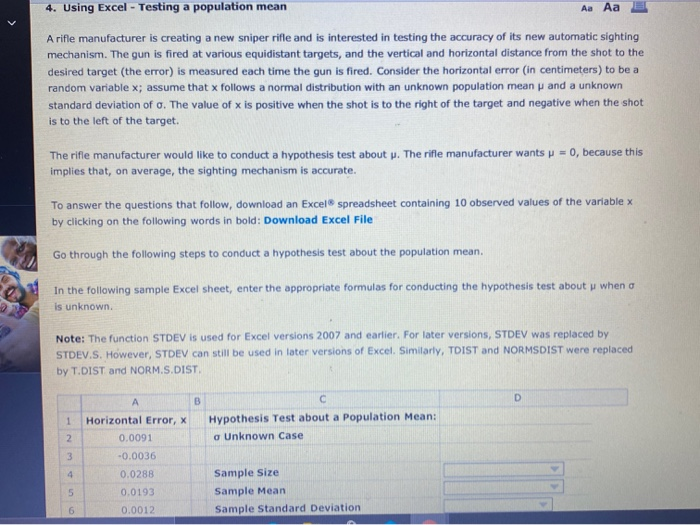
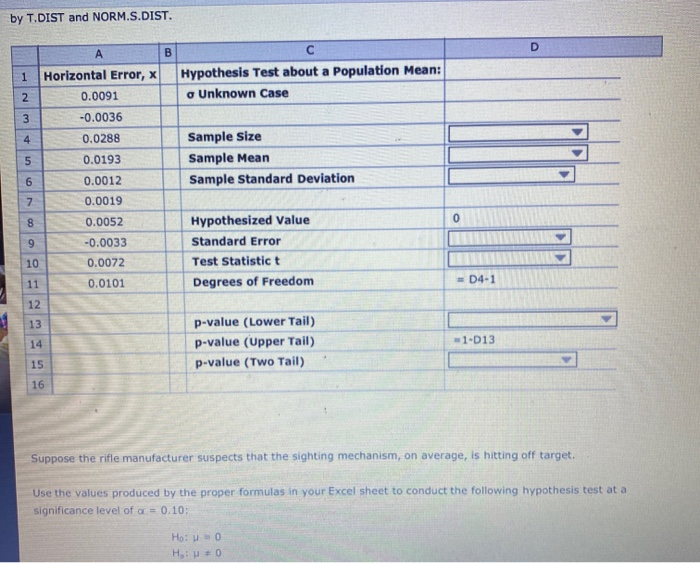
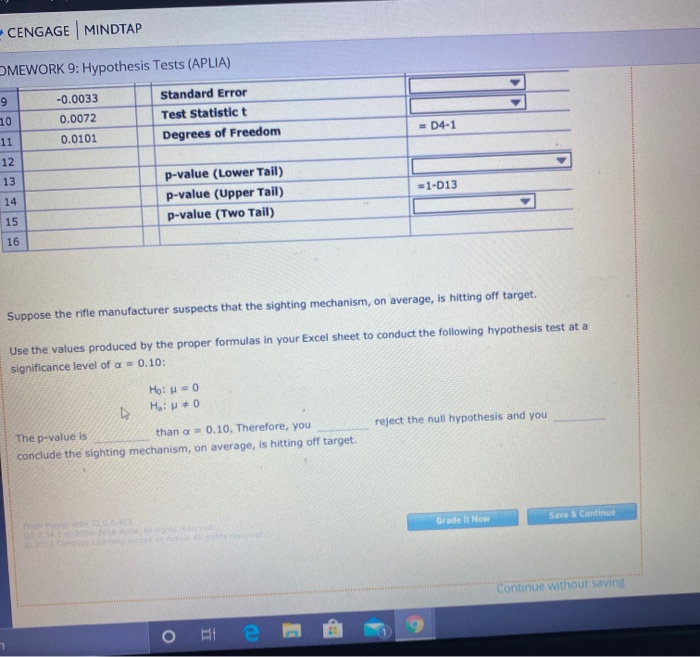
Question: 4. Using Excel - Testing a population mean Aa Aa A rifle manufacturer is creating a new sniper rifle and is interested in testing the

4. Using Excel - Testing a population mean Aa Aa
4. Using Excel - Testing a population mean Aa Aa A rifle manufacturer is creating a new sniper rifle and is interested in testing the accuracy of its new automatic sighting mechanism. The gun is fired at various equidistant targets, and the vertical and horizontal distance from the shot to the desired target (the error) is measured each time the gun is fired. Consider the horizontal error (in centimeters) to be a random variable x; assume that follows a normal distribution with an unknown population mean and a unknown standard deviation of o. The value of x is positive when the shot is to the right of the target and negative when the shot is to the left of the target. The rifle manufacturer would like to conduct a hypothesis test about . The rifle manufacturer wants p = 0, because this implies that, on average, the sighting mechanism is accurate. To answer the questions that follow, download an Excel spreadsheet containing 10 observed values of the variable by clicking on the following words in bold: Download Excel File Go through the following steps to conduct a hypothesis test about the population mean. In the following sample Excel sheet, enter the appropriate formulas for conducting the hypothesis test about when a is unknown Note: The function STDEV is used for Excel versions 2007 and earlier. For later versions, STDEV was replaced by STDEV.S. However, STDEV can still be used in later versions of Excel. Similarly, TOIST and NORMSDIST were replaced by T.DIST and NORM.S.DIST A B D 1 Hypothesis Test about a Population Mean: a Unknown Case 2 3 Horizontal Error, X 0.0091 -0.0036 0.0288 0.0193 4 5 Sample Size Sample Mean Sample Standard Deviation 6 0.0012 by T.DIST and NORM.S.DIST. D B 1 Horizontal Error, x 0.0091 Hypothesis Test about a Population Mean: Unknown Case 2 3 -0.0036 4 0.0288 5 0.0193 Sample Size Sample Mean Sample Standard Deviation 6 0.0012 0.0019 7 8 0.0052 0 9 -0.0033 0.0072 Hypothesized Value Standard Error Test Statistic t Degrees of Freedom 10 11 0.0101 D4-1 12 13 14 p-value (Lower Tail) p-value (Upper Tail) p-value (Two Tail) 1-013 15 16 Suppose the rifle manufacturer suspects that the sighting mechanism, on average, is hitting off target. Use the values produced by the proper formulas in your Excel sheet to conduct the following hypothesis test at a significance level of a = 0.10: How H: 0 CENGAGE MINDTAP 9 -D4-1 MEWORK 9: Hypothesis Tests (APLIA) -0.0033 Standard Error 10 0.0072 Test Statistic t 11 0.0101 Degrees of Freedom 12 13 p-value (Lower Tail) 14 p-value (Upper Tail) 15 p-value (Two Tail) 16 *1-013 Suppose the rifle manufacturer suspects that the sighting mechanism, on average, is hitting off target. Use the values produced by the proper formulas in your Excel sheet to conduct the following hypothesis test at a significance level of a = 0.10: Ho: = 0 : + reject the null hypothesis and you The p-value is than a = 0.10. Therefore, you conclude the sighting mechanism, on average, is hitting off target. Save & Continue Grade It Now Continue without saving o e

Step by Step Solution

There are 3 Steps involved in it

1 Expert Approved Answer
Step: 1 Unlock blur-text-image
Question Has Been Solved by an Expert!

Get step-by-step solutions from verified subject matter experts

Step: 2 Unlock
Step: 3 Unlock

Students Have Also Explored These Related General Management Questions!