

Question: 4. Using the data for Adobe Systems Inc. (Nasdaq: ADBE), presented below 2011 2010 2009 2013 $4,055 423 68 290 2012 54,404 1,180 67 833
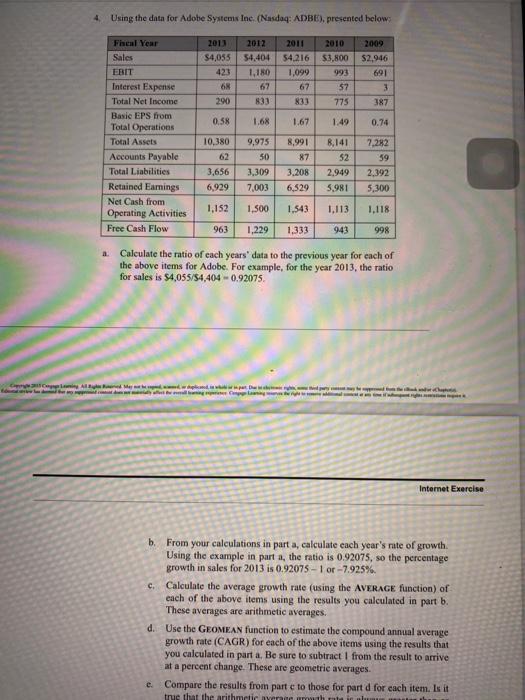
4. Using the data for Adobe Systems Inc. (Nasdaq: ADBE), presented below 2011 2010 2009 2013 $4,055 423 68 290 2012 54,404 1,180 67 833 54.216 1.099 67 833 $3,800 993 57 775 $2.946 691 3 387 0.58 1.68 1.67 1.49 0.74 Fheal Year Sales EBIT Interest Expense Total Net Income Basic EPS from Total Operations Total Assets Accounts Payable Total Liabilities Retained Earnings Net Cash from Operating Activities Free Cash Flow 10,380 9,975 50 3,309 7,003 8,991 87 3.208 6,529 8,141 52 2.949 5.981 7,282 59 2.392 5,300 3,656 6,929 1,152 1,500 1,543 1,113 1.118 963 1,229 1,333 943 998 a Calculate the ratio of each years' data to the previous year for each of the above items for Adobe. For example, for the year 2013, the ratio for sales is $4,055/54,404 -0.92075 Mer thew Internet Exercise c. b. From your calculations in part a, calculate each year's rate of growth. Using the example in part a, the ratio is 0.92075, so the percentage growth in sales for 2013 is 0.92075 - 1 or -7.925% Calculate the average growth rate (using the AVERAGE function) of each of the above items using the results you calculated in part b. These averages are arithmetic averages. d. Use the GEOMEAN function to estimate the compound annual average growth rate (CAGR) for each of the above items using the results that you calculated in part a. Be sure to subtract from the result to arrive at a percent change. These are geometrie averages. Compare the results from parte to those for part d for each item. Is it true that the arithmetic berumah
Step by Step Solution
There are 3 Steps involved in it

Get step-by-step solutions from verified subject matter experts