

Question: 4. Using the following data create a quarterly sales report for Tech Industries 2012: January $70,000 February $90,000 March $800,000 April $420,000 May $70,000 (Note:
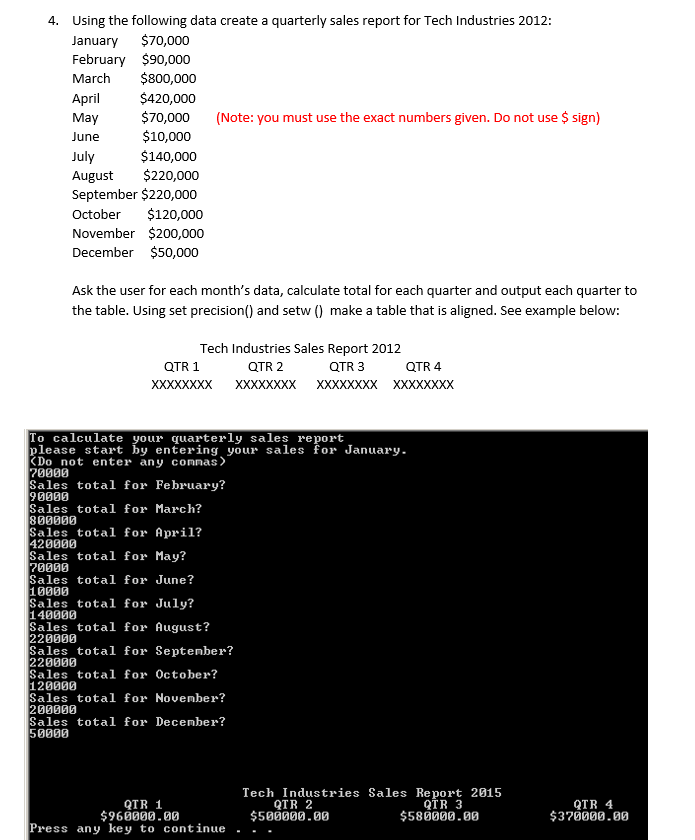
4. Using the following data create a quarterly sales report for Tech Industries 2012: January $70,000 February $90,000 March $800,000 April $420,000 May $70,000 (Note: you must use the exact numbers given. Do not use $ sign) June $10,000 July $140,000 August $220,000 September $220,000 October $120,000 November $200,000 December $50,000 Ask the user for each month's data, calculate total for each quarter and output each quarter to the table. Using set precision() and setw() make a table that is aligned. See example below: Tech Industries Sales Report 2012 QTR 1 QTR 2 QTR 3 QTR 4 XXXXXXXXXXXXXXXX XXXXXXXX XXXXXXXX To calculate your quarterly sales report please start by entering your sales for January. (Do not enter any commas 20000 Sales total for February? 90000 Sales total for March? 800000 Sales total for April? 420000 Sales total for May? 70090 Sales total for June? 10000 Sales total for July? 140000 Sales total for August? 220900 Sales total for Septenber? 220000 Sales total for October? 120000 Sales total for November? 200000 Sales total for December? 50000 QIR 1 $968990.00 Press any key to continue Tech Industries Sales Report 2015 QTR 2 QR 3 $500000.00 $580000.00 QTR 4 $370000.00
Step by Step Solution
There are 3 Steps involved in it

Get step-by-step solutions from verified subject matter experts