

Question: 4. Using the following data, graph your own production possibilities curve. A B C D E Brick Ovens 0 2 4 6 8 Pizzas 40
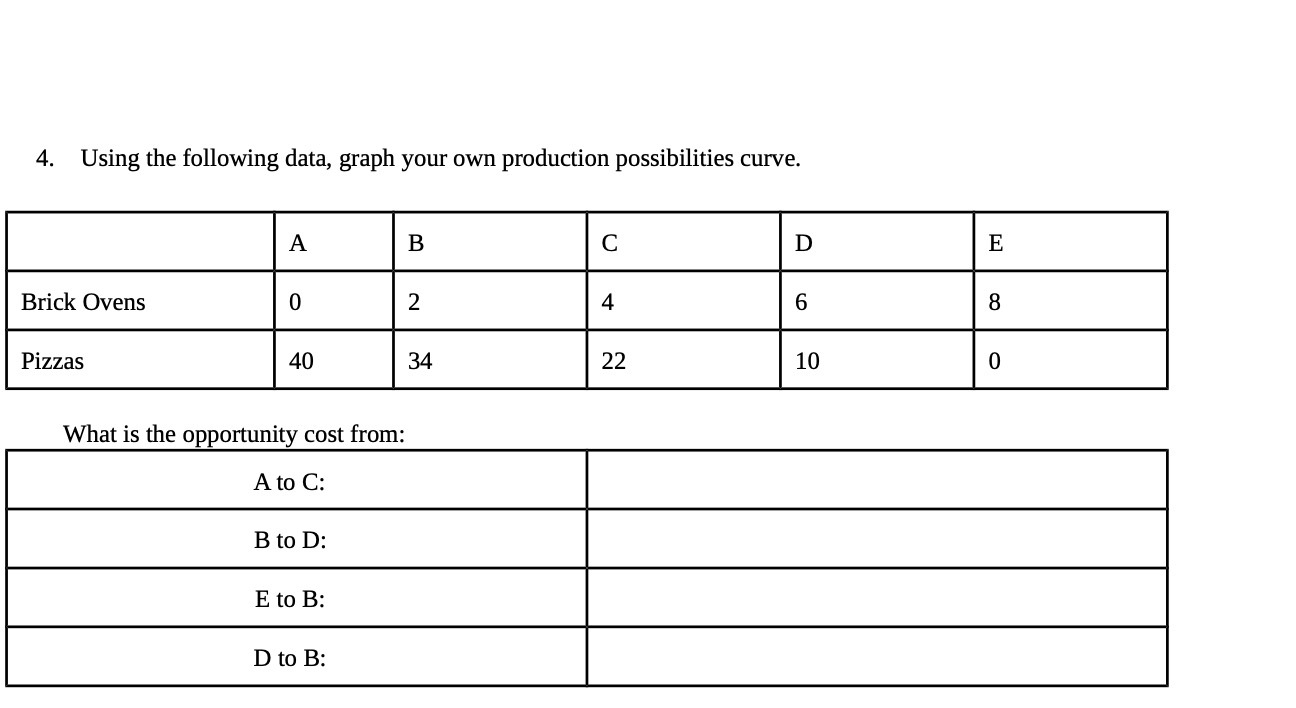
4. Using the following data, graph your own production possibilities curve. A B C D E Brick Ovens 0 2 4 6 8 Pizzas 40 34 22 10 0 What is the opportunity cost from: A to C: B to D: E to B: D to B
Step by Step Solution
There are 3 Steps involved in it
1 Expert Approved Answer
Step: 1 Unlock

Question Has Been Solved by an Expert!
Get step-by-step solutions from verified subject matter experts
Step: 2 Unlock
Step: 3 Unlock