

Question: 4. Using the following data set, answer the questions below. 17.5 15.0 13.4 23.9 25.2 19.5 25.8 30.0 22.5 35.3 39.5 23.5 26.5 21.3
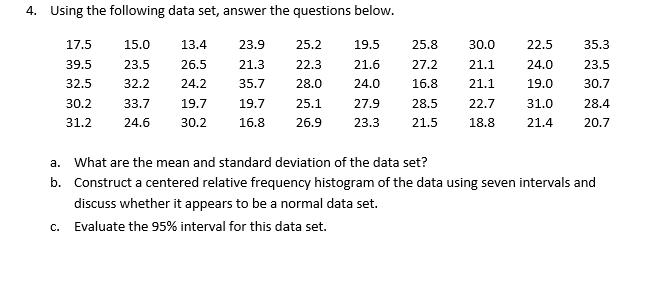
4. Using the following data set, answer the questions below. 17.5 15.0 13.4 23.9 25.2 19.5 25.8 30.0 22.5 35.3 39.5 23.5 26.5 21.3 22.3 21.6 27.2 21.1 24.0 23.5 32.5 32.2 24.2 35.7 28.0 24.0 16.8 21.1 19.0 30.7 30.2 33.7 19.7 19.7 25.1 27.9 28.5 22.7 31.0 28.4 31.2 24.6 30.2 16.8 26.9 23.3 21.5 18.8 21.4 20.7 a. What are the mean and standard deviation of the data set? b. Construct a centered relative frequency histogram of the data using seven intervals and discuss whether it appears to be a normal data set. C. Evaluate the 95% interval for this data set.
Step by Step Solution
There are 3 Steps involved in it
1 Expert Approved Answer
Step: 1 Unlock

Question Has Been Solved by an Expert!
Get step-by-step solutions from verified subject matter experts
Step: 2 Unlock
Step: 3 Unlock