

Question: 4 Using the information provided for obtained) on the previous financial statements, compute the following financial ratios for Merry Time Lighting Information which is necessary
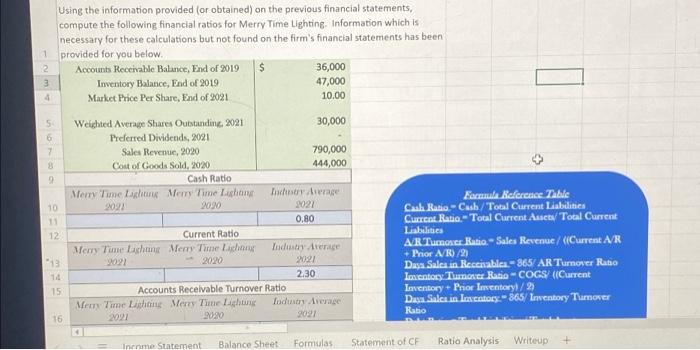
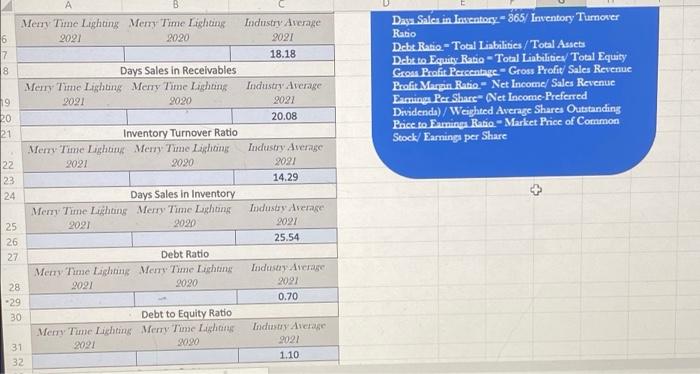
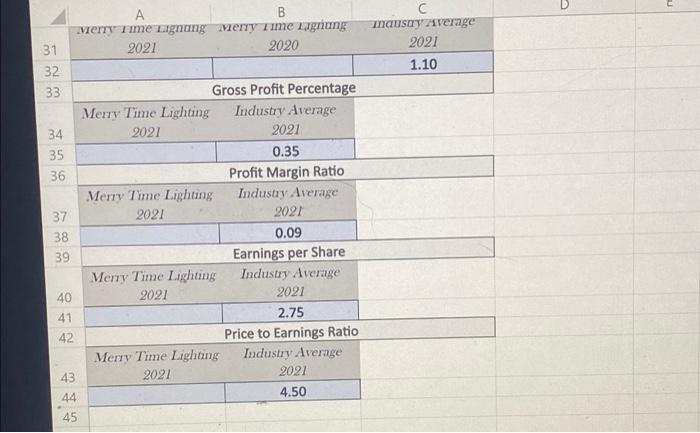
4 Using the information provided for obtained) on the previous financial statements, compute the following financial ratios for Merry Time Lighting Information which is necessary for these calculations but not found on the firm's financial statements has been 1 provided for you below 2 Accounts Receivable Balance, End of 2019 $ 36,000 3 Inventory Balance, End of 2019 47,000 Market Price Per Share, End of 2021 10.00 5 Weighted Average Shares Outstanding 2021 30,000 6 Preferred Dividends, 2021 2 Sales Revenue, 2020 790,000 Cost of Goods Sold, 2020 444,000 Cash Ratio Merry Time Lachine Meny Time Lishon Pachorage Formula Recreace Table 10 2091 20.20 2022 Cash Ratio - Cash/Total Current Liabilities 11 0.80 Current Ratio - Total Current Assets/Total Current 12 Current Ratio Liabilities Merry Time Lachaine Meny Time Lacha Industrie AR Tumar Ratio - Sales Revenue / Current A/R Prior A/R/21 13 2021 2021 Das Salca in Recenablea-865 AR Turnover Rabo 14 2.30 Imetoy Tumor Ratio - COGS (Current 15 Accounts Receivable Turnover Ratio Inventory. Prior Inventory/2) Mrr Time Lightinu Merry Time Lichtung Industry Average Das Salci in lactos 865Inventory Turnover 2021 990 9091 Ratio 3 9 2020 16 Inenme Statement Balance Sheet Formulas Statement of CF Writeup Ratio Analysis Merry Time Lighting Merry Time Lighting 2021 2020 6 7 Industry Average 2021 18.18 18 Days Sales in Receivables Merry Time Lighting Merry Time Lighting 2021 2020 Daya Salcs in Inventory - 365/ Inventory Turnover Ratio Debt Ratio - Total Liabilities/Total Assets Debt to Equity Ratio - Total Liabilities/Total Equity Gross Profit Percentage - Gross Profit Sales Revenue Profit Marpin Ratio - Net Income Sales Revenue Earnings Per Share Net Income Preferred Dividenda)/Weighted Average Shares Outstanding Price to Earnings Ratio - Market Price of Common Stock/Earnings per Share Industry Average 2021 20.08 Inventory Turnover Ratio Merry Time Licham Merry Time Lichong 2021 2020 Industry Average 2021 14.29 Days Sales In Inventory Merry Time Lighting Merry Time Lighting 2021 2020 . Industy Average 2021 25.54 Debt Ratio Meny Time Lighting Mem. Time Lighting 2021 2020 Industry Average 2022 0.70 Debt to Equity Ratio Merry Time Lighting Merry Time Luchong 2094 2190 Industry Asetage 9021 1.10 31 32 A B very Time Lignang merry Time Ligung 2021 2020 maus y average 2021 1.10 31 32 33 34 35 36 37 38 39 Gross Profit Percentage Merry Time Lighting Industry Average 2021 2021 0.35 Profit Margin Ratio Merry Time Lighting Industry Average 2021 2021 0.09 Earnings per Share Merry Time Lighting Industry Average 2021 2021 2.75 Price to Earnings Ratio Merry Time Lighting Industry Average 2021 2021 4.50 40 41 42 43 44 45 B In the space below express your thoughts on Merry Time Lighting's current financial position. Discussion should focus on how the company's financial ratios compare to their previous ratios as well as the industry average 1 4 Using the information provided for obtained) on the previous financial statements, compute the following financial ratios for Merry Time Lighting Information which is necessary for these calculations but not found on the firm's financial statements has been 1 provided for you below 2 Accounts Receivable Balance, End of 2019 $ 36,000 3 Inventory Balance, End of 2019 47,000 Market Price Per Share, End of 2021 10.00 5 Weighted Average Shares Outstanding 2021 30,000 6 Preferred Dividends, 2021 2 Sales Revenue, 2020 790,000 Cost of Goods Sold, 2020 444,000 Cash Ratio Merry Time Lachine Meny Time Lishon Pachorage Formula Recreace Table 10 2091 20.20 2022 Cash Ratio - Cash/Total Current Liabilities 11 0.80 Current Ratio - Total Current Assets/Total Current 12 Current Ratio Liabilities Merry Time Lachaine Meny Time Lacha Industrie AR Tumar Ratio - Sales Revenue / Current A/R Prior A/R/21 13 2021 2021 Das Salca in Recenablea-865 AR Turnover Rabo 14 2.30 Imetoy Tumor Ratio - COGS (Current 15 Accounts Receivable Turnover Ratio Inventory. Prior Inventory/2) Mrr Time Lightinu Merry Time Lichtung Industry Average Das Salci in lactos 865Inventory Turnover 2021 990 9091 Ratio 3 9 2020 16 Inenme Statement Balance Sheet Formulas Statement of CF Writeup Ratio Analysis Merry Time Lighting Merry Time Lighting 2021 2020 6 7 Industry Average 2021 18.18 18 Days Sales in Receivables Merry Time Lighting Merry Time Lighting 2021 2020 Daya Salcs in Inventory - 365/ Inventory Turnover Ratio Debt Ratio - Total Liabilities/Total Assets Debt to Equity Ratio - Total Liabilities/Total Equity Gross Profit Percentage - Gross Profit Sales Revenue Profit Marpin Ratio - Net Income Sales Revenue Earnings Per Share Net Income Preferred Dividenda)/Weighted Average Shares Outstanding Price to Earnings Ratio - Market Price of Common Stock/Earnings per Share Industry Average 2021 20.08 Inventory Turnover Ratio Merry Time Licham Merry Time Lichong 2021 2020 Industry Average 2021 14.29 Days Sales In Inventory Merry Time Lighting Merry Time Lighting 2021 2020 . Industy Average 2021 25.54 Debt Ratio Meny Time Lighting Mem. Time Lighting 2021 2020 Industry Average 2022 0.70 Debt to Equity Ratio Merry Time Lighting Merry Time Luchong 2094 2190 Industry Asetage 9021 1.10 31 32 A B very Time Lignang merry Time Ligung 2021 2020 maus y average 2021 1.10 31 32 33 34 35 36 37 38 39 Gross Profit Percentage Merry Time Lighting Industry Average 2021 2021 0.35 Profit Margin Ratio Merry Time Lighting Industry Average 2021 2021 0.09 Earnings per Share Merry Time Lighting Industry Average 2021 2021 2.75 Price to Earnings Ratio Merry Time Lighting Industry Average 2021 2021 4.50 40 41 42 43 44 45 B In the space below express your thoughts on Merry Time Lighting's current financial position. Discussion should focus on how the company's financial ratios compare to their previous ratios as well as the industry average 1
Step by Step Solution
There are 3 Steps involved in it

Get step-by-step solutions from verified subject matter experts