

Question: 4. Using the sa me data of the problem number 5, prepare a schedule showing a vertical analysis for the year 2010. Accounts Titles Comparative
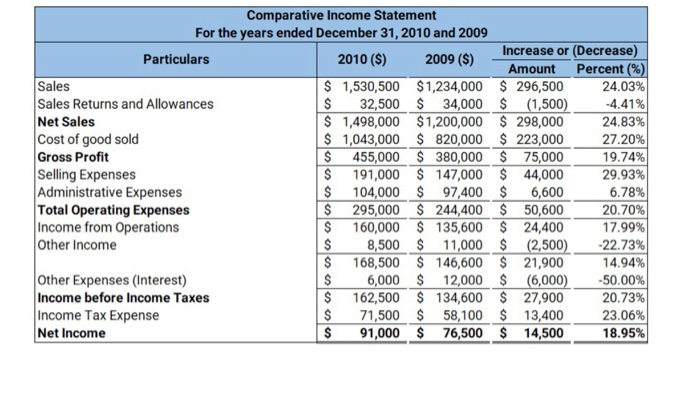
4. Using the sa me data of the problem number 5, prepare a schedule showing a vertical analysis for the year 2010. Accounts Titles Comparative Income Statement For the years ended December 31, 2010 and 2009 Increase or (Decrease) Percent (%) 2009 (S) 2010 ($) Particulars Amount Sales Sales Returns and Allowances Net Sales Cost of good sold Gross Profit Selling Expenses Administrative Expenses Total Operating Expenses Income from Operations Other Income $ 1,530,500 $1,234,000 $ 296,500 $ 24.03% 32,500 $ 34,000 (1,500) $ 1,498,000 $1,200,000 $ 298,000 $ 1,043,000 $ 820,000 223,000 455,000 380,000 $ 75,000 $ -4.41% 24.83% 27.20% 19.74% 191,000 $ 147,000 $ 44,000 $ 29.93% 6.78% 20.70% 17.99% 104,000 $ 97,400 $ 295,000 $ 244,400 $ 50,600 160,000 $ 135,600 $ 24,400 $ 6,600 11,000 $ (2,500) 8,500 $ 22.73% $ 168,500 $ 146,600 $ 21,900 6,000 $ 12,000 $ (6,000) $ 14.94% Other Expenses (Interest) Income before Income Taxes Income Tax Expense Net Income -50.00% 20.73% 23.06% 18.95% 162,500 $ 134,600 $ 27,900 $ 71,500 $ 58,100 $ 13,400 91,000 $ 76,500 $ 14,500
Step by Step Solution
There are 3 Steps involved in it

Get step-by-step solutions from verified subject matter experts