

Question: 4 Using the SAT dataset, a model is fit with the total SAT score as the dependent variable and expend, salary, ratio and takers as
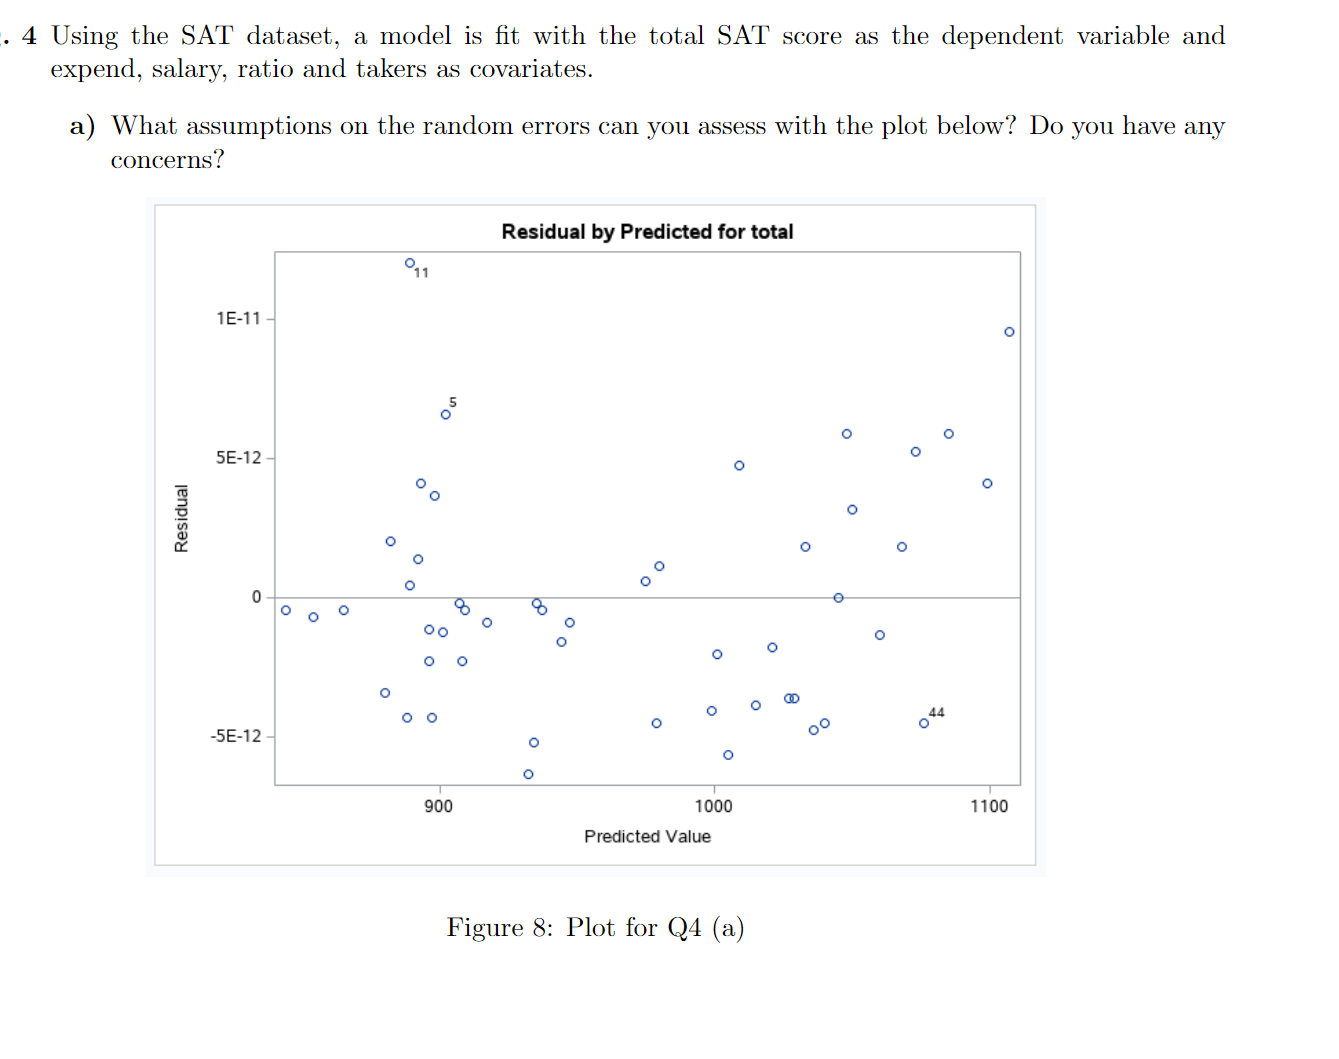
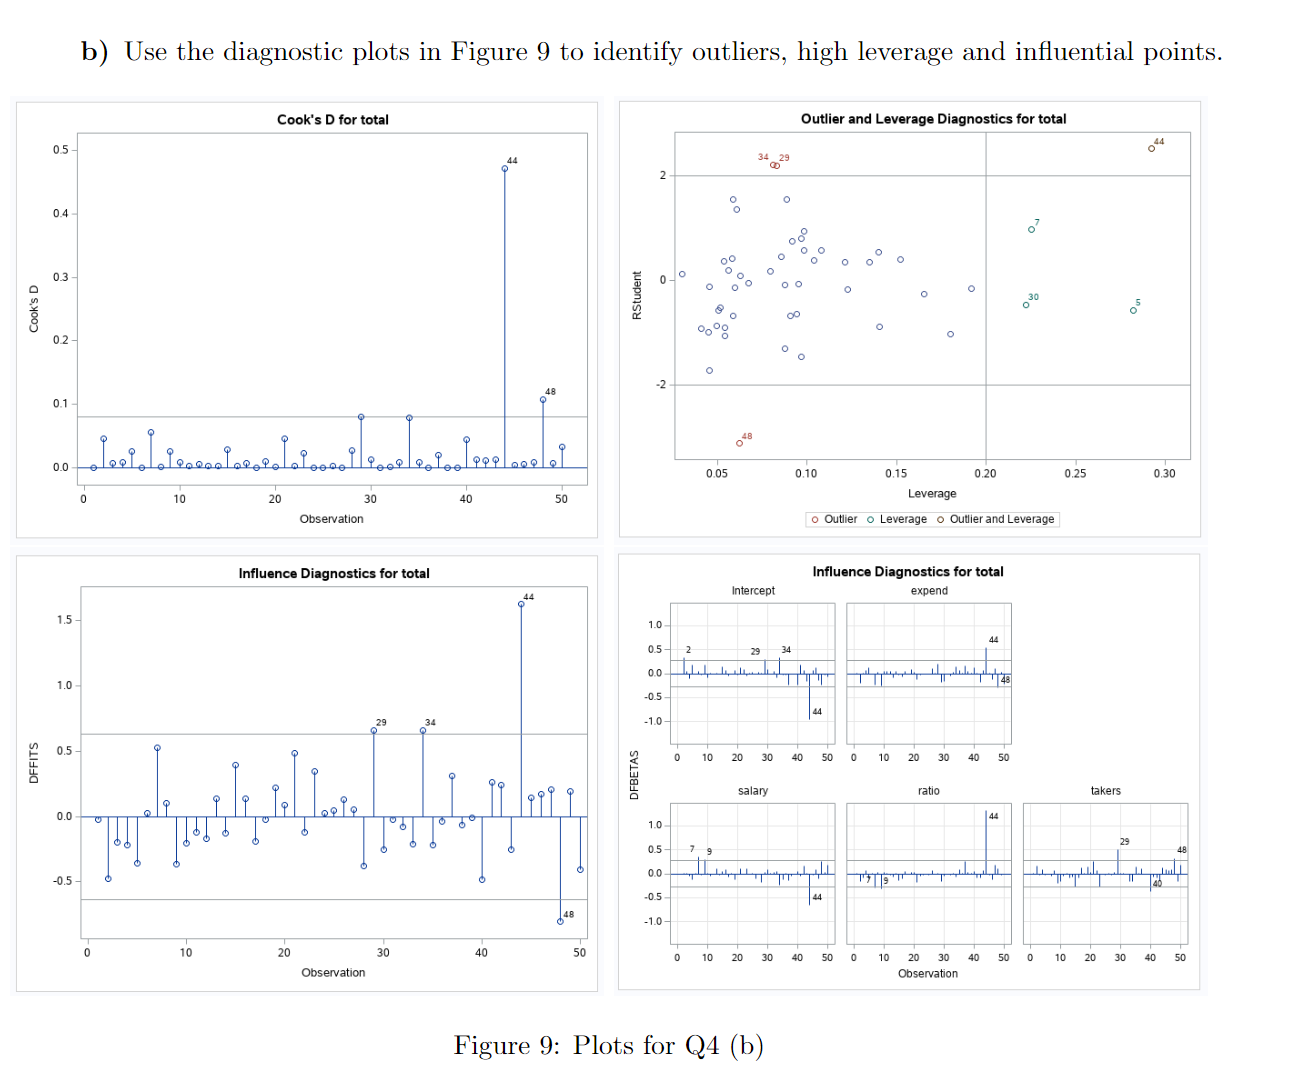
4 Using the SAT dataset, a model is fit with the total SAT score as the dependent variable and expend, salary, ratio and takers as covariates. a) What assumptions on the random errors can you assess with the plot below? Do you have any concerns? Residual by Predicted for total 1E-11 - O 5E-12- O O Residual O O C O O 0- O O OC C O O O -5E-12 O OO O O 900 1000 1100 Predicted Value Figure 8: Plot for Q4 (a)b) Use the diagnostic plots in Figure 9 to identify outliers, high leverage and influential points. Cook's D for total Outlier and Leverage Diagnostics for total 044 05 34 2 0.4 03 RStudent 30 Cook's D 0.2 48 0.1 48 0.05 0.10 0.15 0.20 0,25 0.30 Leverage 10 20 30 40 50 Observation o Outlier . Leverage o Outlier and Leverage Influence Diagnostics for total Influence Diagnostics for total Intercept expend 1.5- 1.0 0.5- 29 34 1.0 -0.5 1.0 DFFITS 0 10 20 30 40 0.5 DFBETAS 0 10 20 30 40 50 salary ratio takers 0.0- 1.0 0.5- 0.0- Tab -0.5 - -0.5 44 10 10 20 30 40 50 0 10 20 30 40 50 0 10 20 30 40 50 0 10 20 30 40 50 Observation Observation Figure 9: Plots for Q4 (b)
Step by Step Solution
There are 3 Steps involved in it

Get step-by-step solutions from verified subject matter experts