

4. We are interested in the effect on test scores of the student-teacher ratio (STR). The...
Fantastic news! We've Found the answer you've been seeking!
Question:
Transcribed Image Text:
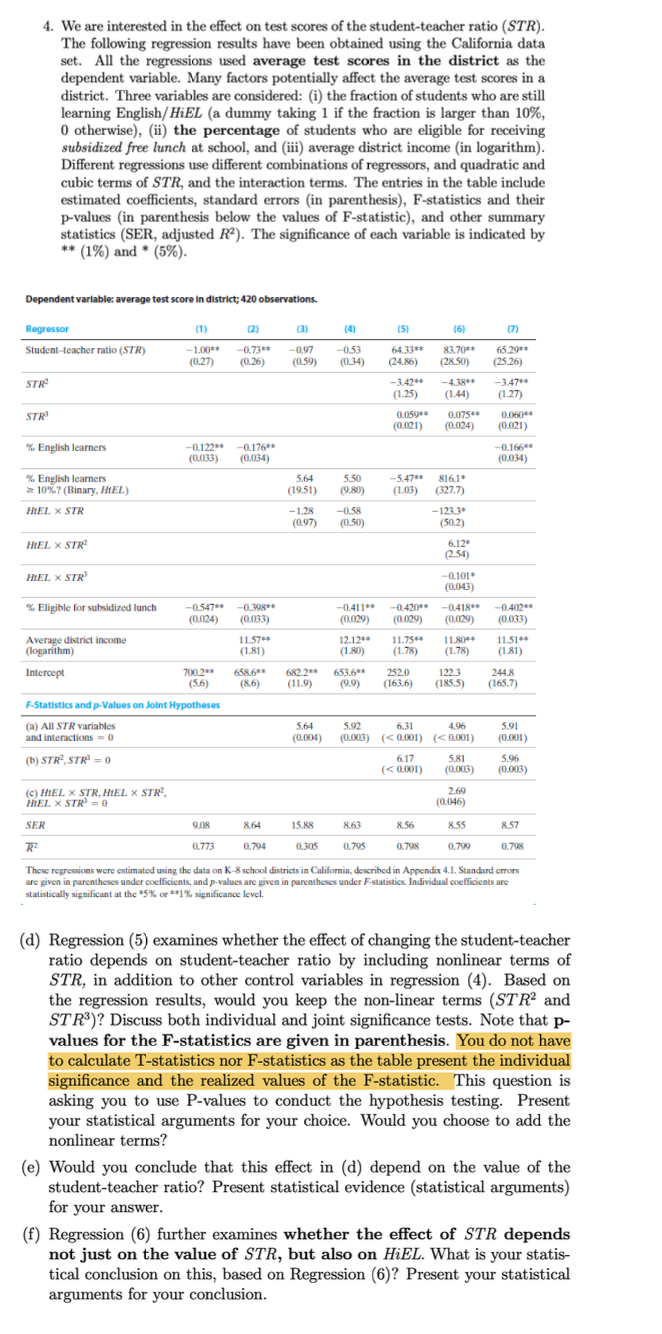
4. We are interested in the effect on test scores of the student-teacher ratio (STR). The following regression results have been obtained using the California data set. All the regressions used average test scores in the district as the dependent variable. Many factors potentially affect the average test scores in a district. Three variables are considered: (i) the fraction of students who are still learning English/HiEL (a dummy taking 1 if the fraction is larger than 10%, 0 otherwise), (ii) the percentage of students who are eligible for receiving subsidized free lunch at school, and (iii) average district income (in logarithm). Different regressions use different combinations of regressors, and quadratic and cubic terms of STR, and the interaction terms. The entries in the table include estimated coefficients, standard errors (in parenthesis), F-statistics and their p-values (in parenthesis below the values of F-statistic), and other summary statistics (SER, adjusted R). The significance of each variable is indicated by ** (1%) and (5%). Dependent variable: average test score in district; 420 observations. Regressor (1) (2) (3) (4) (5) (6) (7) Student-teacher ratio (STR) -1.00** -0.73** -0.97 -0.53 64.33** 83.70** 65.29** (0.27) (0.26) (0.59) (0.34) (24.86) (28.50) (25.26) STR -3.42** -4.38** -3.47** (1.25) (1.44) (1.27) STR 0.059** (0.021) 0.075** (0.024) 0.060** (0.021) % English learners -0.122 (0,033) -0.176** (0.034) **9910- (0.034) % English learners 10%? (Binary, HIEL) 5.64 (19.51) (9.80) 5.50 -5.47** 816.1* (1.03) (327.7) HIEL STR -1.28 -0.58 -123.3 (0.97) (0.50) (50.2) HIEL STR 6.12* (2.54) HIEL STR -0.101* (0.043) % Eligible for subsidized lunch -0.547** -0.398 (0.024) -0.411** -0.420** -0.418** -0.402** (0,033) (0.029) (0.029) (0.029) (0,033) Average district income (logarithm) 11.57** (1.81) 12.12** (1.80) 11.75** 11.80** (1.78) (1.78) 11.51** (1.81) Intercept 700.2** (5.6) 658.6** 682.2** (8.6) (11.9) 653.6** 252.0 (9.9) (163.6) 122.3 (185.5) 244.8 (165.7) F-Statistics and p-values on Joint Hypotheses (a) All STR variables and interactions -0 (b) STR, STR = 0 (c) HIEL X STR, HIEL STR, HIEL X STR=0 SER R 5.64 5.92 6.31 (0.004) (0.003) ( <0.001) ( <0.001) 4.96 5.91 (0.001) 6.17 ( <0.001) 5.81 (0.003) 5.96 (0.003) 2.69 (0.046) 9.08 8.64 15.88 8.63 8.56 8.55 8.57 0.773 0.794 0.305 0.795 0.798 0.799 0.798 These regressions were estimated using the data on K-8 school districts in California, described in Appendix 4.1. Standard errors are given in parentheses under coefficients, and p-values are given in parentheses under F-statistics. Individual coefficients are statistically significant at the *5% or **1% significance level. (d) Regression (5) examines whether the effect of changing the student-teacher ratio depends on student-teacher ratio by including nonlinear terms of STR, in addition to other control variables in regression (4). Based on the regression results, would you keep the non-linear terms (STR and STR)? Discuss both individual and joint significance tests. Note that p- values for the F-statistics are given in parenthesis. You do not have to calculate T-statistics nor F-statistics as the table present the individual significance and the realized values of the F-statistic. This question is asking you to use P-values to conduct the hypothesis testing. Present your statistical arguments for your choice. Would you choose to add the nonlinear terms? (e) Would you conclude that this effect in (d) depend on the value of the student-teacher ratio? Present statistical evidence (statistical arguments) for your answer. (f) Regression (6) further examines whether the effect of STR depends not just on the value of STR, but also on HiEL. What is your statis- tical conclusion on this, based on Regression (6)? Present your statistical arguments for your conclusion. 4. We are interested in the effect on test scores of the student-teacher ratio (STR). The following regression results have been obtained using the California data set. All the regressions used average test scores in the district as the dependent variable. Many factors potentially affect the average test scores in a district. Three variables are considered: (i) the fraction of students who are still learning English/HiEL (a dummy taking 1 if the fraction is larger than 10%, 0 otherwise), (ii) the percentage of students who are eligible for receiving subsidized free lunch at school, and (iii) average district income (in logarithm). Different regressions use different combinations of regressors, and quadratic and cubic terms of STR, and the interaction terms. The entries in the table include estimated coefficients, standard errors (in parenthesis), F-statistics and their p-values (in parenthesis below the values of F-statistic), and other summary statistics (SER, adjusted R). The significance of each variable is indicated by ** (1%) and (5%). Dependent variable: average test score in district; 420 observations. Regressor (1) (2) (3) (4) (5) (6) (7) Student-teacher ratio (STR) -1.00** -0.73** -0.97 -0.53 64.33** 83.70** 65.29** (0.27) (0.26) (0.59) (0.34) (24.86) (28.50) (25.26) STR -3.42** -4.38** -3.47** (1.25) (1.44) (1.27) STR 0.059** (0.021) 0.075** (0.024) 0.060** (0.021) % English learners -0.122 (0,033) -0.176** (0.034) **9910- (0.034) % English learners 10%? (Binary, HIEL) 5.64 (19.51) (9.80) 5.50 -5.47** 816.1* (1.03) (327.7) HIEL STR -1.28 -0.58 -123.3 (0.97) (0.50) (50.2) HIEL STR 6.12* (2.54) HIEL STR -0.101* (0.043) % Eligible for subsidized lunch -0.547** -0.398 (0.024) -0.411** -0.420** -0.418** -0.402** (0,033) (0.029) (0.029) (0.029) (0,033) Average district income (logarithm) 11.57** (1.81) 12.12** (1.80) 11.75** 11.80** (1.78) (1.78) 11.51** (1.81) Intercept 700.2** (5.6) 658.6** 682.2** (8.6) (11.9) 653.6** 252.0 (9.9) (163.6) 122.3 (185.5) 244.8 (165.7) F-Statistics and p-values on Joint Hypotheses (a) All STR variables and interactions -0 (b) STR, STR = 0 (c) HIEL X STR, HIEL STR, HIEL X STR=0 SER R 5.64 5.92 6.31 (0.004) (0.003) ( <0.001) ( <0.001) 4.96 5.91 (0.001) 6.17 ( <0.001) 5.81 (0.003) 5.96 (0.003) 2.69 (0.046) 9.08 8.64 15.88 8.63 8.56 8.55 8.57 0.773 0.794 0.305 0.795 0.798 0.799 0.798 These regressions were estimated using the data on K-8 school districts in California, described in Appendix 4.1. Standard errors are given in parentheses under coefficients, and p-values are given in parentheses under F-statistics. Individual coefficients are statistically significant at the *5% or **1% significance level. (d) Regression (5) examines whether the effect of changing the student-teacher ratio depends on student-teacher ratio by including nonlinear terms of STR, in addition to other control variables in regression (4). Based on the regression results, would you keep the non-linear terms (STR and STR)? Discuss both individual and joint significance tests. Note that p- values for the F-statistics are given in parenthesis. You do not have to calculate T-statistics nor F-statistics as the table present the individual significance and the realized values of the F-statistic. This question is asking you to use P-values to conduct the hypothesis testing. Present your statistical arguments for your choice. Would you choose to add the nonlinear terms? (e) Would you conclude that this effect in (d) depend on the value of the student-teacher ratio? Present statistical evidence (statistical arguments) for your answer. (f) Regression (6) further examines whether the effect of STR depends not just on the value of STR, but also on HiEL. What is your statis- tical conclusion on this, based on Regression (6)? Present your statistical arguments for your conclusion.
Expert Answer:

Posted Date:
Students also viewed these mathematics questions
-
1. An auditor selected a product maintained in the finished goods Warehouse. The auditor counted the product and compare this amount what the amount in the finished goods Perpetual inventory...
-
On January 1, 2011, the stockholders equity section of Rowen Corporation shows: common stock ($5 par value) $1,500,000; paid-in capital in excess of par value $1,000,000; and retained earnings...
-
List, describe, and differentiate between two group formation models?
-
Skyway Inc. identified a cost pool related to material handling costs for its manufacturing process. Using historical data and ordinary least squares regression, Skyway summarized two different...
-
Cora Manufacturing makes fashion products and competes on the basis of quality and leading- edge designs. The company has $ 2,500,000 invested in assets in its clothing manufacturing division. After-...
-
Part I: A. Consider "Habit 4: Think Win/Win." Apply at least two(2) concepts from the habit to your personal experience. What is your current personal paradigm? Do you see the value in considering...
-
- Background and introduction - Review of possible research method - Selection of research method and justification - Describing the process of research - Population, samples, and respondents -...
-
The bars AB and AC are joined by a pin at A and a horizontal cable. The vertical cable carrying the 200 kg mass is attached to the pin at A. Determine the tension in the horizontal cable. Neglect the...
-
What does stockholders' equity represent?\ A residual claim against the book value of the firm's assets. (The book value of the firm's assets less the book value of its liabilities.)\ A fixed claim...
-
3.2 Three steel rods (L= 350 mm, A1 = 50 mm, A2 = 40 mm, A3 = 30 mm, E = 210 000 N/mm) are mounted a) in series and b) parallel. Calculate the forces F; and the compression stresses op inside the...
-
A5.21 A multithreaded web server wishes to keep track of the number of requests it services (known as hits). Consider the two following strategies to prevent a race condition on the variable hits....
-
1. Determine the stability condition for the given structure assuming that the links are rigid. (sina sino -2lcosa -2lcose- k www ||
-
Xilinx (Pvt) is a California based manufacturer of electronic components that are used by major manufacturers of electronic products across the globe. The company was setup in Silicon Valley in 1984...
-
An Atomic Energy Commission nuclear facility was established in Hanford, Washington, in 1943. Over the years, a significant amount of strontium 90 and cesium 137 leaked into the Columbia River. In a...
-
All Canadian corporations must comply with international accounting standards.
-
Most Canadian corporations are listed on the Toronto Stock Exchange.
-
IFRS must be used for the financial statements of every Canadian public corporation.

Study smarter with the SolutionInn App