

Question: 4. What happened to Current Liabilities, increase or decrease? Why - what accounts caused the growth or decline? What account makes up the largest percentage
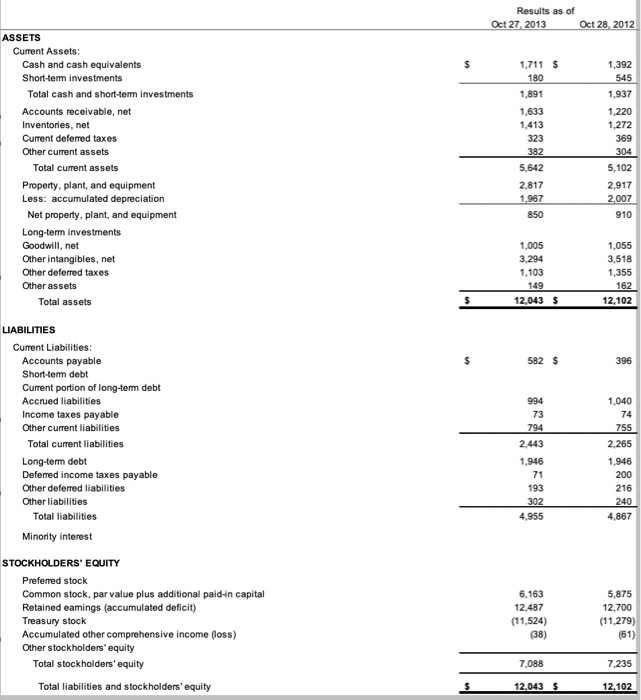
Results as of Oct 27, 2013 Oct 28, 2012 1,711 $ 180 1.891 1.633 1,413 323 1.392 545 1.937 1,220 1.272 369 ASSETS Current Assets: Cash and cash equivalents Short-term investments Total cash and short-term investments Accounts receivable, net Inventories, net Current deferred taxes Other current assets Total current assets Property, plant, and equipment Less: accumulated depreciation Net property, plant, and equipment Long-term investments Goodwill, net Other intangibles, net Other deferred taxes Other assets Total assets 5.642 2.817 1.967 850 5,102 2.917 2,007 910 1,005 3.294 1,103 149 12,043 $ 1,055 3,518 1,355 162 12,102 582 $ 1,040 994 73 74 LIABILITIES Current Liabilities: Accounts payable Short-term debt Current portion of long-term debt Accrued liabilities Income taxes payable Other current liabilities Total current liabilities Long-term debt Deferred income taxes payable Other deferred liabilities Other liabilities Total liabilities 794 2.443 1.946 71 755 2,265 1.946 200 216 240 4.867 193 302 4.955 Minority interest STOCKHOLDERS' EQUITY Preferred stock Common stock, par value plus additional paid in capital Retained eamings (accumulated deficit) Treasury stock Accumulated other comprehensive income (loss) Other stockholders' equity Total stockholders' equity 6.163 12.487 (11.524) (38) 5.875 12.700 (11.279) (61) 7.235 7,088 12.043 Total liabilities and stockholders' equity
Step by Step Solution
There are 3 Steps involved in it

Get step-by-step solutions from verified subject matter experts