

Question: 4. Work on problem 15 from the problems and exercises section at the end of chapter 9 of Evans. Excel file Nuclear Power is attached
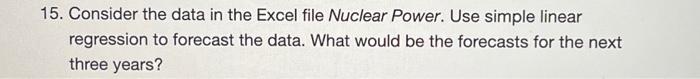
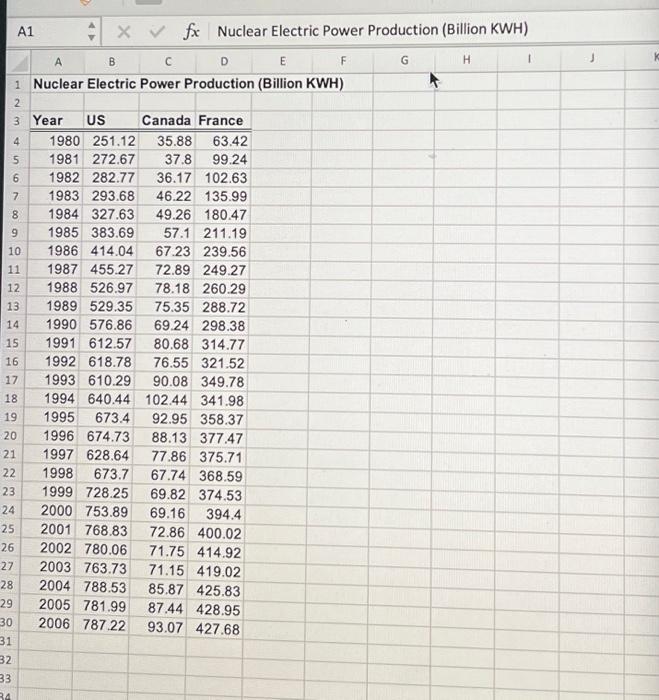
4. Work on problem 15 from the problems and exercises section at the end of chapter 9 of Evans. Excel file Nuclear Power is attached (20 pts). Hint: Go through the Worked example 9.12 from Chapter 9 of the textbook. 15. Consider the data in the Excel file Nuclear Power. Use simple linear regression to forecast the data. What would be the forecasts for the next three years? \begin{tabular}{|r|r|r|r|r|} \hline \multicolumn{2}{|c|}{ A1 } & A & X & \multicolumn{2}{c|}{fx} & Nucle \\ \hline & A & B & \multicolumn{1}{c|}{ C } & D \\ \hline 1 & Nuclear & Electric & Power Production \\ \hline 2 & & & & \\ \hline 3 & Year & US & Canada & France \\ \hline 4 & 1980 & 251.12 & 35.88 & 63.42 \\ \hline 5 & 1981 & 272.67 & 37.8 & 99.24 \\ \hline 6 & 1982 & 282.77 & 36.17 & 102.63 \\ \hline 7 & 1983 & 293.68 & 46.22 & 135.99 \\ \hline 8 & 1984 & 327.63 & 49.26 & 180.47 \\ \hline 9 & 1985 & 383.69 & 57.1 & 211.19 \\ \hline 10 & 1986 & 414.04 & 67.23 & 239.56 \\ \hline 11 & 1987 & 455.27 & 72.89 & 249.27 \\ \hline 12 & 1988 & 526.97 & 78.18 & 260.29 \\ \hline 13 & 1989 & 529.35 & 75.35 & 288.72 \\ \hline 14 & 1990 & 576.86 & 69.24 & 298.38 \\ \hline 15 & 1991 & 612.57 & 80.68 & 314.77 \\ \hline 16 & 1992 & 618.78 & 76.55 & 321.52 \\ \hline 17 & 1993 & 610.29 & 90.08 & 349.78 \\ \hline 18 & 1994 & 640.44 & 102.44 & 341.98 \\ \hline 19 & 1995 & 673.4 & 92.95 & 358.37 \\ \hline 20 & 1996 & 674.73 & 88.13 & 377.47 \\ \hline 21 & 1997 & 628.64 & 77.86 & 375.71 \\ \hline 22 & 1998 & 673.7 & 67.74 & 368.59 \\ \hline 23 & 1999 & 728.25 & 69.82 & 374.53 \\ \hline 24 & 2000 & 753.89 & 69.16 & 394.4 \\ \hline 25 & 2001 & 768.83 & 72.86 & 400.02 \\ \hline 26 & 2002 & 780.06 & 71.75 & 414.92 \\ \hline 27 & 2003 & 763.73 & 71.15 & 419.02 \\ \hline 28 & 2004 & 788.53 & 85.87 & 425.83 \\ \hline 29 & 2005 & 781.99 & 87.44 & 428.95 \\ \hline 30 & 2006 & 787.22 & 93.07 & 427.68 \\ \hline 1 & & & & \end{tabular} 4. Work on problem 15 from the problems and exercises section at the end of chapter 9 of Evans. Excel file Nuclear Power is attached (20 pts). Hint: Go through the Worked example 9.12 from Chapter 9 of the textbook. 15. Consider the data in the Excel file Nuclear Power. Use simple linear regression to forecast the data. What would be the forecasts for the next three years? \begin{tabular}{|r|r|r|r|r|} \hline \multicolumn{2}{|c|}{ A1 } & A & X & \multicolumn{2}{c|}{fx} & Nucle \\ \hline & A & B & \multicolumn{1}{c|}{ C } & D \\ \hline 1 & Nuclear & Electric & Power Production \\ \hline 2 & & & & \\ \hline 3 & Year & US & Canada & France \\ \hline 4 & 1980 & 251.12 & 35.88 & 63.42 \\ \hline 5 & 1981 & 272.67 & 37.8 & 99.24 \\ \hline 6 & 1982 & 282.77 & 36.17 & 102.63 \\ \hline 7 & 1983 & 293.68 & 46.22 & 135.99 \\ \hline 8 & 1984 & 327.63 & 49.26 & 180.47 \\ \hline 9 & 1985 & 383.69 & 57.1 & 211.19 \\ \hline 10 & 1986 & 414.04 & 67.23 & 239.56 \\ \hline 11 & 1987 & 455.27 & 72.89 & 249.27 \\ \hline 12 & 1988 & 526.97 & 78.18 & 260.29 \\ \hline 13 & 1989 & 529.35 & 75.35 & 288.72 \\ \hline 14 & 1990 & 576.86 & 69.24 & 298.38 \\ \hline 15 & 1991 & 612.57 & 80.68 & 314.77 \\ \hline 16 & 1992 & 618.78 & 76.55 & 321.52 \\ \hline 17 & 1993 & 610.29 & 90.08 & 349.78 \\ \hline 18 & 1994 & 640.44 & 102.44 & 341.98 \\ \hline 19 & 1995 & 673.4 & 92.95 & 358.37 \\ \hline 20 & 1996 & 674.73 & 88.13 & 377.47 \\ \hline 21 & 1997 & 628.64 & 77.86 & 375.71 \\ \hline 22 & 1998 & 673.7 & 67.74 & 368.59 \\ \hline 23 & 1999 & 728.25 & 69.82 & 374.53 \\ \hline 24 & 2000 & 753.89 & 69.16 & 394.4 \\ \hline 25 & 2001 & 768.83 & 72.86 & 400.02 \\ \hline 26 & 2002 & 780.06 & 71.75 & 414.92 \\ \hline 27 & 2003 & 763.73 & 71.15 & 419.02 \\ \hline 28 & 2004 & 788.53 & 85.87 & 425.83 \\ \hline 29 & 2005 & 781.99 & 87.44 & 428.95 \\ \hline 30 & 2006 & 787.22 & 93.07 & 427.68 \\ \hline 1 & & & & \end{tabular}
Step by Step Solution
There are 3 Steps involved in it

Get step-by-step solutions from verified subject matter experts