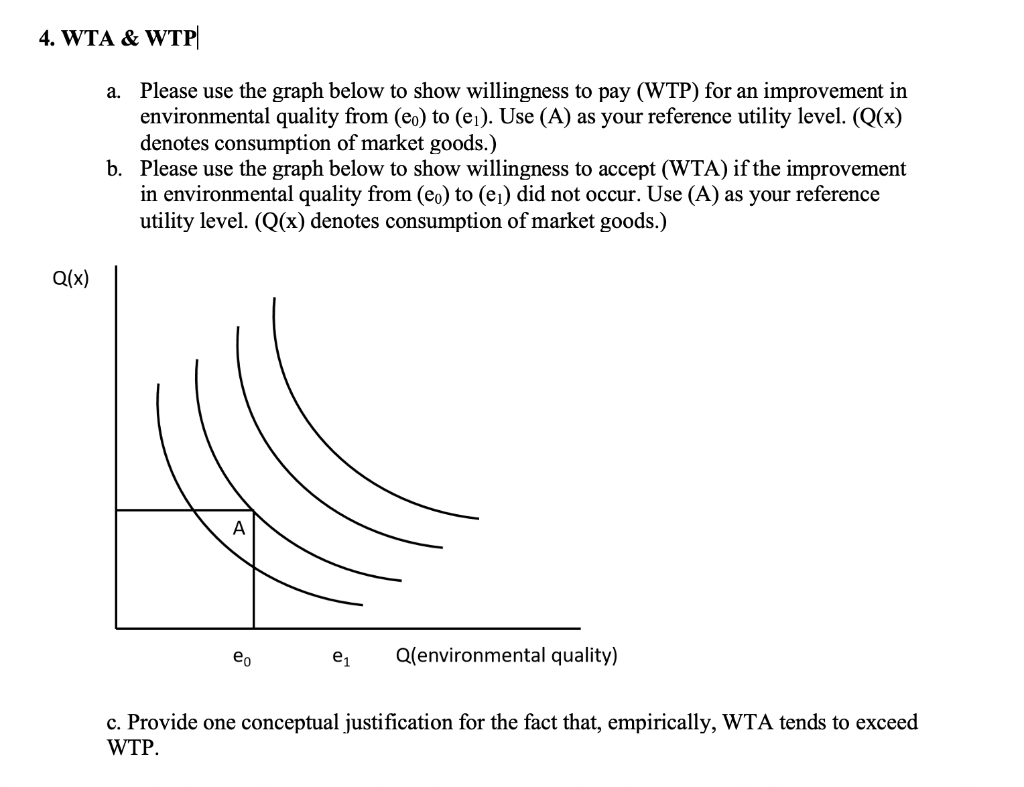
Question: 4. WTA & WTP a. Please use the graph below to show willingness to pay (WTP) for an improvement in environmental quality from (eo) to

4. WTA & WTP a. Please use the graph below to

4. WTA & WTP a. Please use the graph below to show willingness to pay (WTP) for an improvement in environmental quality from (eo) to (ei). Use (A) as your reference utility level. (Q(x) denotes consumption of market goods.) b. Please use the graph below to show willingness to accept (WTA) if the improvement in environmental quality from (eo) to (ei) did not occur. Use (A) as your reference utility level. (Q(x) denotes consumption of market goods.) Q(x) eo e1 Q(environmental quality) c. Provide one conceptual justification for the fact that, empirically, WTA tends to exceed WTP

Step by Step Solution

There are 3 Steps involved in it

1 Expert Approved Answer
Step: 1 Unlock blur-text-image
Question Has Been Solved by an Expert!

Get step-by-step solutions from verified subject matter experts

Step: 2 Unlock
Step: 3 Unlock

Students Have Also Explored These Related General Management Questions!