

Question: 40. Regression Analysis Using Excel (Appendix) a. Format of printouts will vary, but data should be consistent with the information below. SUMMARY OUTPUT Regression Statistics
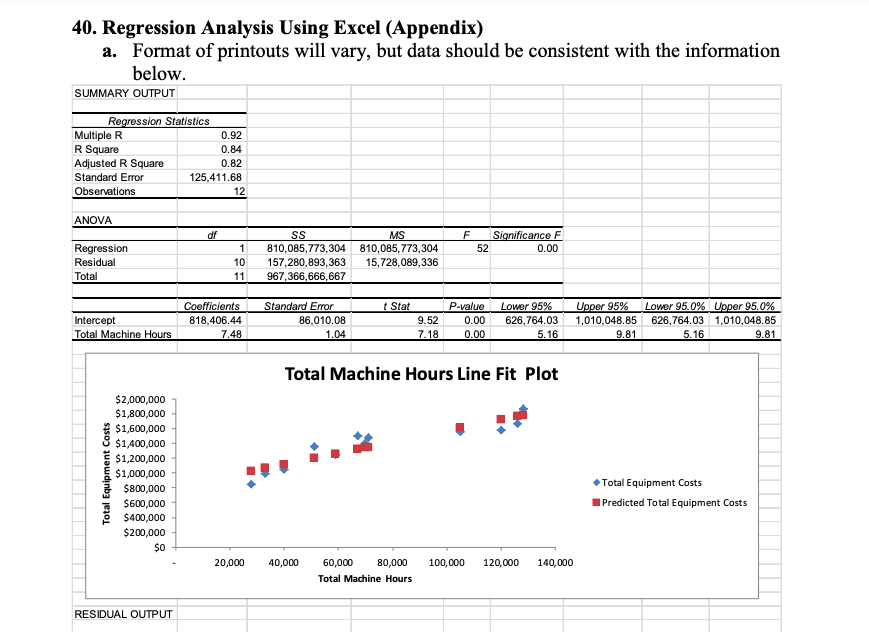
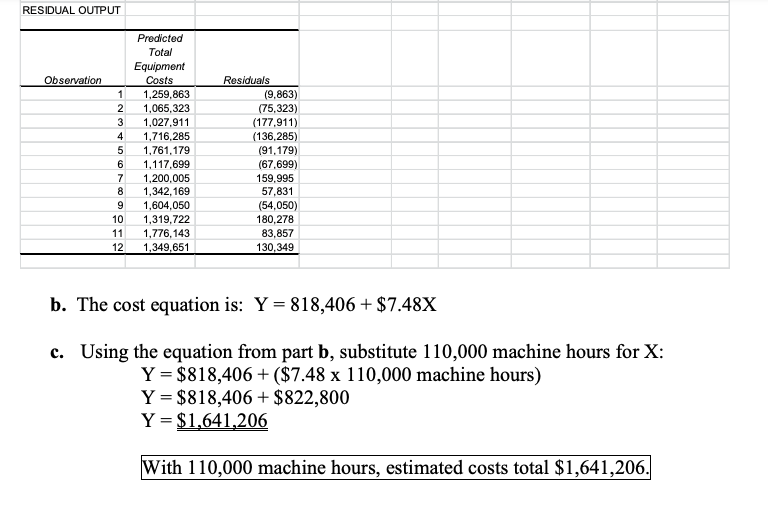
40. Regression Analysis Using Excel (Appendix) a. Format of printouts will vary, but data should be consistent with the information below. SUMMARY OUTPUT Regression Statistics Multiple R 0.92 R Square 0.84 Adjusted R Square 0.82 Standard Error 125,411.68 Observations 12 ANOVA df F Significance F 0.00 52 Regression Residual Total 1 10 11 SS MS 810,085,773,304 810,085,773,304 157,280,893,363 15,728,089,336 967,366,666,667 Intercept Total Machine Hours Coefficients 818,406.44 7.48 Standard Error 86,010.08 1.04 t Stat 9.52 7.18 P-value 0.00 0.00 Lower 95% 626,764.03 5.16 Upper 95% 1,010,048.85 9.81 Lower 95.0% Upper 95.0% 626,764.03 1,010,048.85 5.16 9.81 Total Machine Hours Line Fit Plot K Total Equipment Costs $2,000,000 $1,800,000 $1,600,000 $1,400,000 $1,200,000 $1,000,000 $800,000 $600,000 $400,000 $200,000 $0 Total Equipment Costs Predicted Total Equipment Costs 20,000 40,000 100,000 120,000 140,000 60,000 80,000 Total Machine Hours RESIDUAL OUTPUT RESIDUAL OUTPUT Observation 1 2 3 4 5 6 7 8 9 10 11 12 Predicted Total Equipment Costs 1,259,863 1,065,323 1,027.911 1,716,285 1,761,179 1,117,699 1,200,005 1,342, 169 1,604,050 1,319,722 1,776,143 1,349,651 Residuals (9,863) (75,323) (177,911) (136,285) (91,179) (67,699) 159,995 57,831 (54,050) 180,278 83,857 130,349 b. The cost equation is: Y = 818,406 + $7.48X c. Using the equation from part b, substitute 110,000 machine hours for X: Y = $818,406+ ($7.48 x 110,000 machine hours) Y = $818,406 + $822,800 Y = $1,641,206 With 110,000 machine hours, estimated costs total $1,641,206. 40. Regression Analysis Using Excel (Appendix) a. Format of printouts will vary, but data should be consistent with the information below. SUMMARY OUTPUT Regression Statistics Multiple R 0.92 R Square 0.84 Adjusted R Square 0.82 Standard Error 125,411.68 Observations 12 ANOVA df F Significance F 0.00 52 Regression Residual Total 1 10 11 SS MS 810,085,773,304 810,085,773,304 157,280,893,363 15,728,089,336 967,366,666,667 Intercept Total Machine Hours Coefficients 818,406.44 7.48 Standard Error 86,010.08 1.04 t Stat 9.52 7.18 P-value 0.00 0.00 Lower 95% 626,764.03 5.16 Upper 95% 1,010,048.85 9.81 Lower 95.0% Upper 95.0% 626,764.03 1,010,048.85 5.16 9.81 Total Machine Hours Line Fit Plot K Total Equipment Costs $2,000,000 $1,800,000 $1,600,000 $1,400,000 $1,200,000 $1,000,000 $800,000 $600,000 $400,000 $200,000 $0 Total Equipment Costs Predicted Total Equipment Costs 20,000 40,000 100,000 120,000 140,000 60,000 80,000 Total Machine Hours RESIDUAL OUTPUT RESIDUAL OUTPUT Observation 1 2 3 4 5 6 7 8 9 10 11 12 Predicted Total Equipment Costs 1,259,863 1,065,323 1,027.911 1,716,285 1,761,179 1,117,699 1,200,005 1,342, 169 1,604,050 1,319,722 1,776,143 1,349,651 Residuals (9,863) (75,323) (177,911) (136,285) (91,179) (67,699) 159,995 57,831 (54,050) 180,278 83,857 130,349 b. The cost equation is: Y = 818,406 + $7.48X c. Using the equation from part b, substitute 110,000 machine hours for X: Y = $818,406+ ($7.48 x 110,000 machine hours) Y = $818,406 + $822,800 Y = $1,641,206 With 110,000 machine hours, estimated costs total $1,641,206
Step by Step Solution
There are 3 Steps involved in it

Get step-by-step solutions from verified subject matter experts