

Question: 40) The two histograms below display the exact same data. How do the plots differ? 112 1a 0.15 15 {1.1 1a 0.05 5 o n
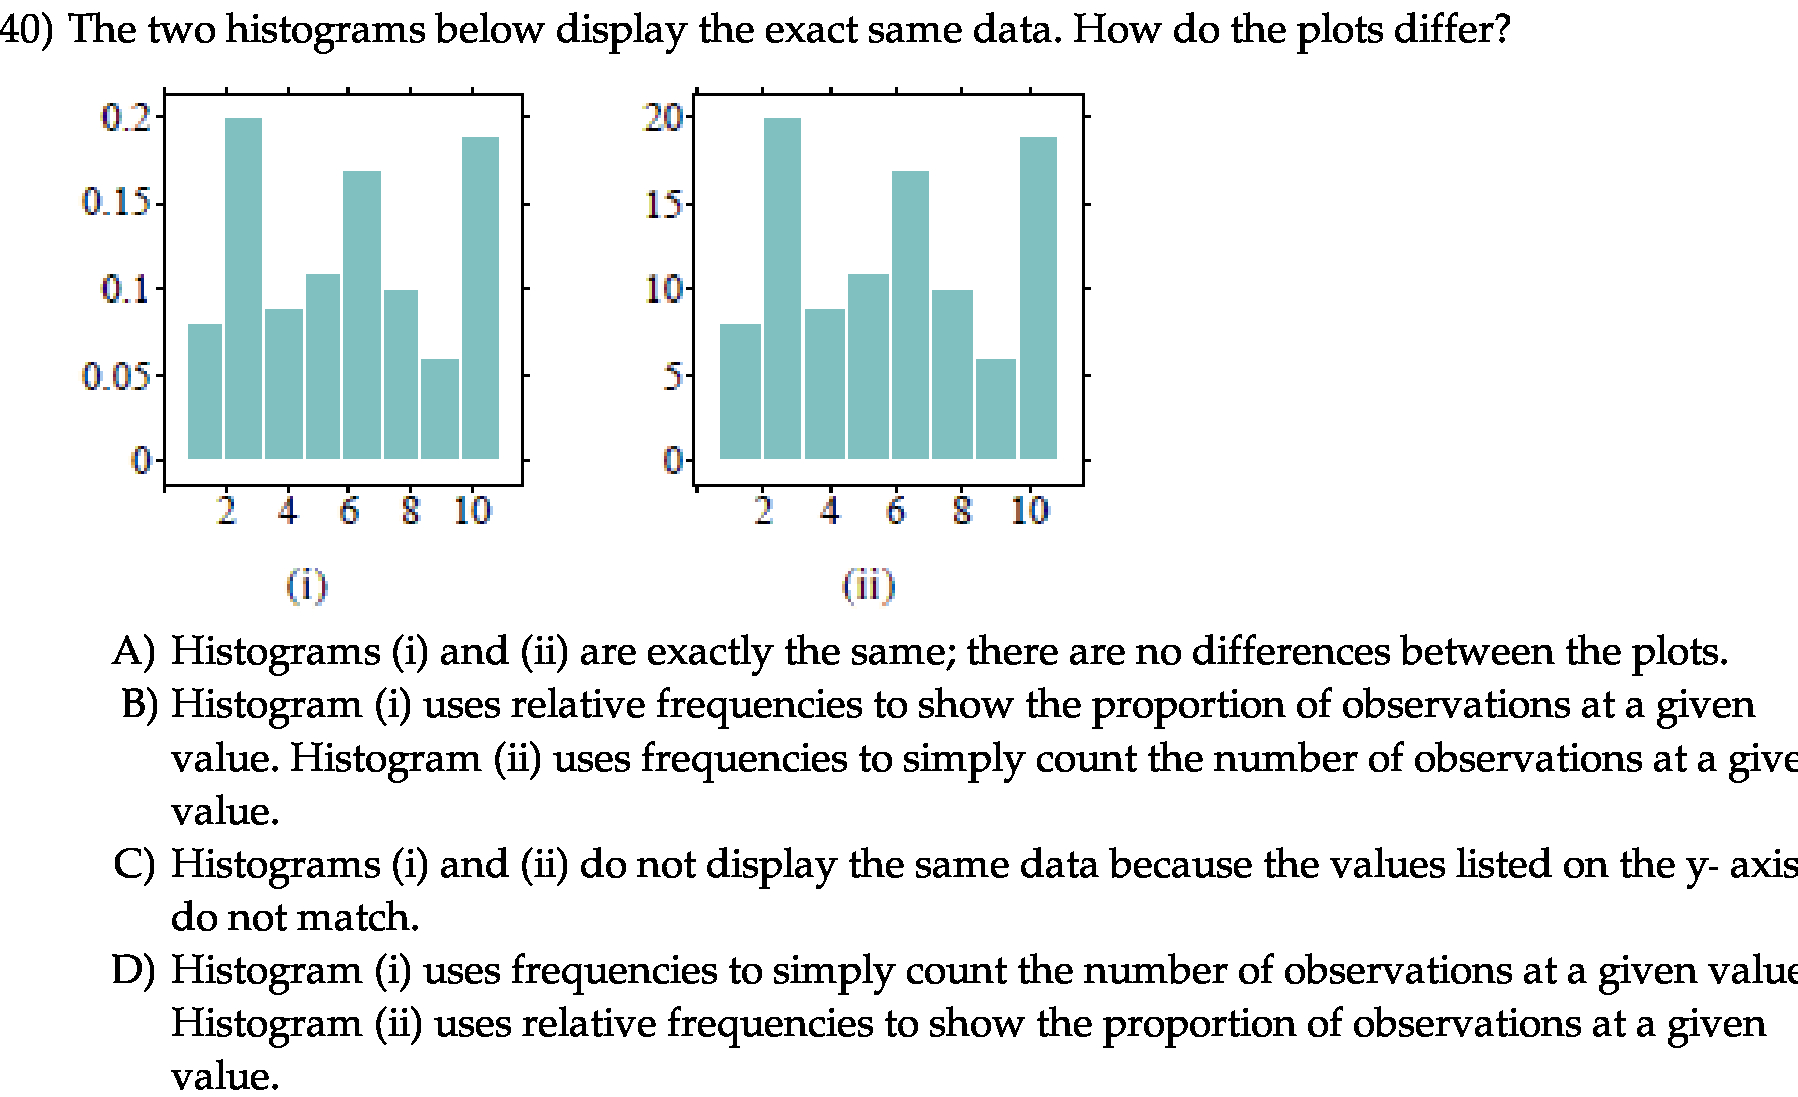
40) The two histograms below display the exact same data. How do the plots differ? 112 1a 0.15 15 {1.1 1a 0.05 5 o n 1 :1 :5 a m 2 4 a a 10 {i} {ii} A) Histograms (i) and (ii) are exactly the same; there are no differences between the plots. B) Histogram (i) uses relative frequencies to show the proportion of observations at a given value. Histogram (ii) uses frequencies to simply count the number of observations at a give value. C) Histograms (i) and (ii) do not display the same data because the values listed on the y- axis do not match. D) Histogram (i) uses frequencies to simply count the number of observations at a given value Histogram (ii) uses relative frequencies to show the proportion of observations at a given value
Step by Step Solution
There are 3 Steps involved in it

Get step-by-step solutions from verified subject matter experts