

Question: (40pts) Write a MATLAB program that will calculate the least squares line fit y-a+bx to a given set of data points (x, y). Your program
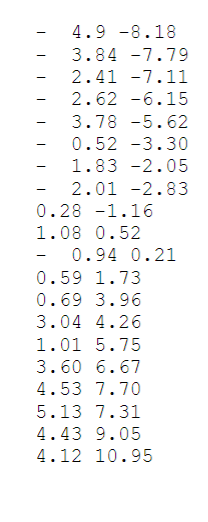
(40pts) Write a MATLAB program that will calculate the least squares line fit y-a+bx to a given set of data points (x, y). Your program should consist of the following function and script: 3. I. A function lin_lsqfit.m capable of calculating the least square estimates of the regression constants a and b. The function has the form [a,b] -lin_lsqfit(x,y), where x and y are the input vectors with the data points. The output variables a, b. You can use any programming approach you want. However, you cannot use any built-in regression functions in MATLAB, such as polyfit. II. A script run_lin_lsqfit.m which does the following: Loads a file containing the data points. A set of data is provided on the Canvas in the file data.txt, which you should use to test program. Do not use the input function to prompt the user for a file name. Just load the file directly from the script file. a. b. Calls lin_Isqfit.m to calculate a and b. c. Plots the data and the least squares fit line on a graph. In the title, write the values of a and b. Make sure to annotate the axes of the graph and include a legend. (40pts) Write a MATLAB program that will calculate the least squares line fit y-a+bx to a given set of data points (x, y). Your program should consist of the following function and script: 3. I. A function lin_lsqfit.m capable of calculating the least square estimates of the regression constants a and b. The function has the form [a,b] -lin_lsqfit(x,y), where x and y are the input vectors with the data points. The output variables a, b. You can use any programming approach you want. However, you cannot use any built-in regression functions in MATLAB, such as polyfit. II. A script run_lin_lsqfit.m which does the following: Loads a file containing the data points. A set of data is provided on the Canvas in the file data.txt, which you should use to test program. Do not use the input function to prompt the user for a file name. Just load the file directly from the script file. a. b. Calls lin_Isqfit.m to calculate a and b. c. Plots the data and the least squares fit line on a graph. In the title, write the values of a and b. Make sure to annotate the axes of the graph and include a legend
Step by Step Solution
There are 3 Steps involved in it

Get step-by-step solutions from verified subject matter experts