

Question: 4-1 Exercise Two: Ratio Analysis Instructions In this assignment, you will calculate various ratios from the financial statements of the Microsoft Corporation (MSFT). The income
4-1 Exercise Two: Ratio Analysis
Instructions
In this assignment, you will calculate various ratios from the financial statements of the Microsoft Corporation (MSFT). The income statement, balance sheet, and cash flow statement are provided for you. You will calculate the ratios listed on the handout. This exercise will assist you in successfully completing the final project requirements. Calculations (or Excel formulas) must be shown.
Liquidity Ratios
- Current Ratio = Current Assets / Current Liabilities
- Quick Ratio = (Current Assets Inventory) / Current Liabilities
Leverage Ratios
- Long-term Debt/Equity Ratio = Long-term Debt / Equity
- Total Debt/Equity Ratio = (Short-term Debts + Long-term Debts) / Equity
Profitability Ratios
- Net Profit Margin = Net Profit after Taxation / Sales
- Operating Profit Margin = Operating Profit / Sales
- Return on Equity = Net Profit after Taxation / Equity
- Return on Total Assets = Net Profit after Taxation / Total Assets
- Return on Capital Employed = Net Profit after Taxation / (Total Assets Current Liabilities)
Efficiency Ratios
- Inventory Turnover = Sales / Inventory
- Assets Turnover = Sales / Total Assets
Market Value Ratios
- Price Earning Ratio = Current Stock Price / Earnings Per Share (EPS)
Other Fundamental Indicators
- Earnings Per Share (EPS) = Net Profit after Taxation / Issued Common Shares
- Net Asset Value (NAV) = (Total Assets Total Liabilities) / Issued Common Shares
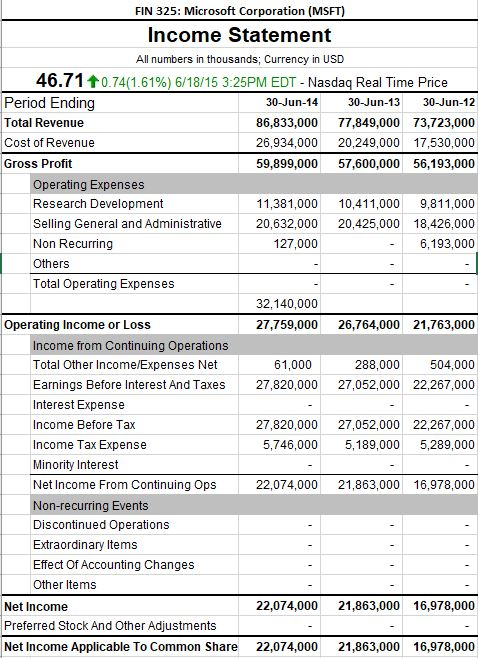
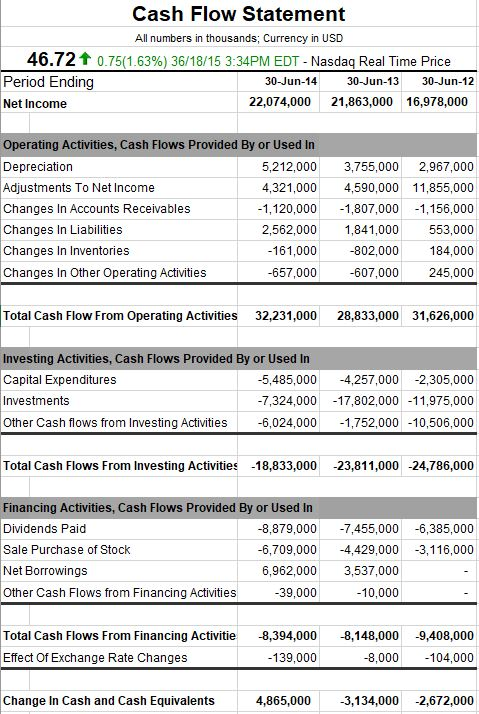
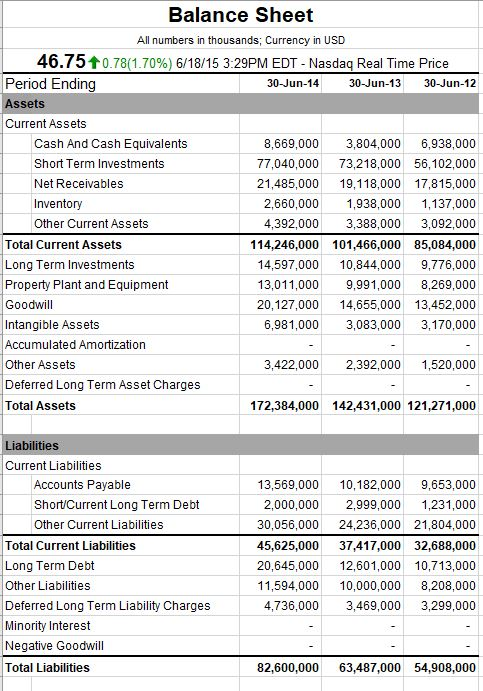
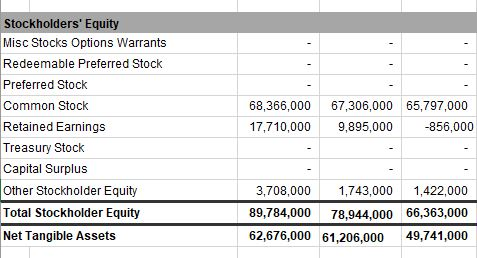
FIN 325: Microsoft Corporation (MSFT) Income Statement All numbers in thousands; Currency in USD 46.710.74(1.61%) 6/18/15 3:25PM EDT - Nasdaq Real Time Price Period Ending 30-Jun-14 30-Jun-13 30-Jun-12 Total Revenue 86,833,000 77,849,000 73,723,000 Cost of Revenue 26,934,000 20,249,000 17,530,000 Gross Profit 59,899,000 57,600,000 56,193,000 Operating Expenses Research Development 11,381,000 10,411,000 9,811,000 Selling General and Administrative 20,632,000 20,425,000 18,426,000 Non Recurring 127,000 6,193,000 Others Total Operating Expenses 32,140,000 Operating Income or Loss 27,759,000 26,764,000 21,763,000 Income from Continuing Operations 61,000 Total Other Income/Expenses Net 288,000 504,000 Earnings Before Interest And Taxes 27,820,000 27,052,000 22,267,000 Interest Expense Income Before Tax 27,820,000 27,052,000 22,267,000 Income Tax Expense 5,289,000 5,746,000 5,189,000 Minority Interest Net Income From Continuing Ops 21,863,000 16,978,000 22,074,000 Non-recurring Events Discontinued Operations Extraordinary Items Effect Of Accounting Changes Other Items Net Income 22,074,000 21,863,000 16,978,000 Preferred Stock And Other Adjustments Net Income Applicable To Common Share 22,074,000 21,863,000 16,978,000 Cash Flow Statement All numbers in thousands; Currency in USD 46.72 0.75(1.63%) 36/18/15 3:34PPM EDT - Nasdaq Real Time Price Period Ending Net Income 30-Jun-14 30-Jun-13 30-Jun-12 22,074,000 21,863,000 16,978,000 Operating Activities, Cash Flows Provided By or Used In Depreciation Adjustments To Net Income Changes In Accounts Receivables 5,212,000 3,755,000 2,967,000 4,321,000 4,590,000 11,855,000 -1,120,000 -1,807,000 -1,156,000| Changes In Liabilities 2,562,000 1,841,000 553,000 Changes In Inventories 161,000 -802,000 184,000 Changes In Other Operating Activities -657,000 -607,000 245,000 Total Cash Flow From Operating Activities 32,231,000 28,833,000 31,626,000 Investing Activities, Cash Flows Provided By or Used In Capital Expenditures -5,485,000 -4,257,000 2,305,000 Investments -7,324,000 -17,802,000 -11,975,000 Other Cash flows from Investing Activities -6,024,000 -1,752,000 -10,506,000 Total Cash Flows From Investing Activities -18,833,000 -23,811,000 -24,786,000 Financing Activities, Cash Flows Provided By or Used In -7,455,000 -6,385,000 Dividends Paid -8,879,000 Sale Purchase of Stock -6,709,000 -4,429,000 -3,16,000 Net Borrowings 6,962,000 3,537,000 -39,000 Other Cash Flows from Financing Activities -10,000 Total Cash Flows From Financing Activitie -8,394,000 -8,148,000 9,408,000 Effect Of Exchange Rate Changes -8,000 104,000 139,000 Change In Cash and Cash Equivalents 4,865,000 -3,134,000 2,672,000 Balance Sheet All numbers in thousands; Currency in USD 46.75t0.78(1.70%) 6/18/15 3:29PM EDT Nasdaq Real Time Price Period Ending 30-Jun-14 30-Jun-13 30-Jun-12 Assets Current Assets Cash And Cash Equivalents 8,669,000 3,804,000 6,938,000 Short Term Investments 77,040,000 73,218,000 56,102,000 Net Receivables 19,118,000 17,815,000 21,485,000 Inventory 2,660,000 1,938,000 1,137,000 Other Current Assets 4,392,000 3,388,000 3,092,000 Total Current Assets 114,246,000 101,466,000 85,084,000 Long Term Investments 14,597,000 10,844,000 9,776,000 8,269,000 Property Plant and Equipment 13,011,000 9,991,000 20,127,000 Goodwill 14,655,000 13,452,000 Intangible Assets Accumulated Amortization 6,981,000 3,083,000 3,170,000 Other Assets 3,422,000 2,392,000 1,520,000 Deferred Long Term Asset Charges Total Assets 172,384,000 142,431,000 121,271,000 Liabilities Current Liabilities Accounts Payable 9,653,000 13,569,000 10,182,000 2,000,000 Short/Current Long Term Debt 2,999,000 1,231,000 30,056,000 Other Current Liabilities 24,236,000 21,804,000 Total Current Liabilities 45,625,000 37,417,000 32,688,000 Long Term Debt 20,645,000 12,601,000 10,713,000 Other Liabilities 11,594,000 10,000,000 8,208,000 Deferred Long Term Liability Charges 4,736,000 3,469,000 3,299,000 Minority Interest Negative Goodwill Total Liabilities 82,600,000 63,487,000 54,908,000 Stockholders' Equity Misc Stocks Options Warrants Redeemable Preferred Stock Preferred Stock Common Stock 68,366,000 67,306,000 65,797,000 Retained Earnings Treasury Stock Capital Surplus Other Stockholder Equity 17,710,000 9,895,000 -856,000 3,708,000 1,743,000 1,422,000 Total Stockholder Equity 89,784,000 78,944,000 66,363,000 62,676,000 61,206,000 Net Tangible Assets 49,741,000
Step by Step Solution
There are 3 Steps involved in it

Get step-by-step solutions from verified subject matter experts