

Question: 4.1 Explanatory and response variables? You have data on a large group of college students. Here are four pairs of variables measured on these students.
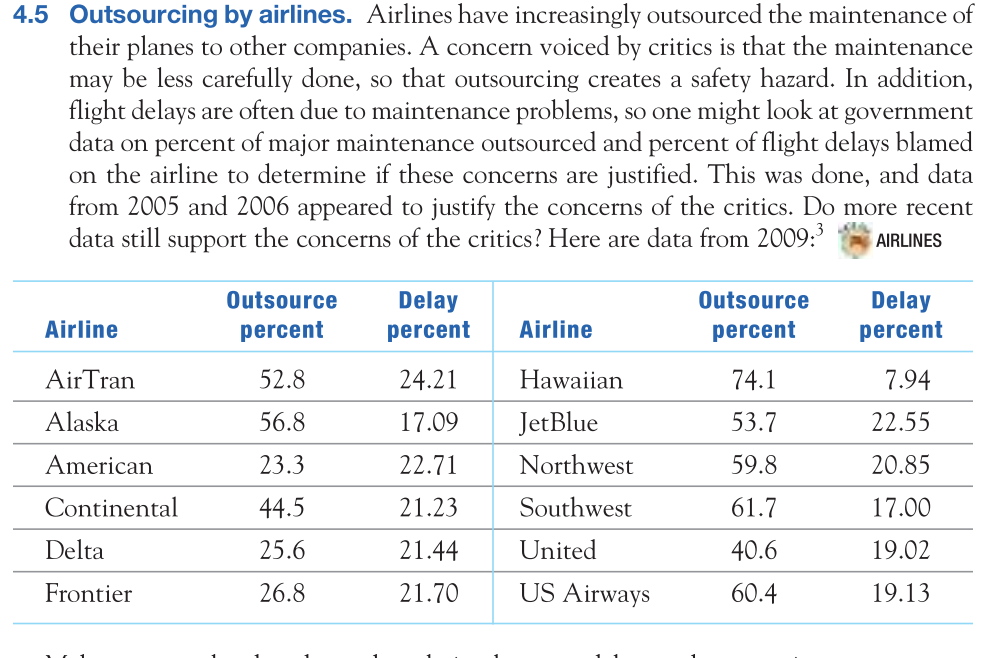
4.1 Explanatory and response variables? You have data on a large group of college students. Here are four pairs of variables measured on these students. For each pair, is it more reasonable to simply explore the relationship between the two variables or to view one of the variables as an explanatory variable and the other as a response variable? In the latter case, which is the explanatory variable and which is the response variable? (a) Amount of time spent studying for a statistics exam and grade on the exam. (b) Weight in kilograms and height in centimeters. (c) Hours per week spent online using Facebook and grade point average. (d) Score on the SAT Writing exam and score on the SAT Critical Reading exam. 4.5 Outsourcing by airlines. Airlines have increasingly outsourced the maintenance of their planes to other companies. A concern voiced by critics is that the maintenance may be less carefully done, so that outsourcing creates a safety hazard. In addition, ight delays are often due to maintenance problems, so one might look at government data on percent of major maintenance outsourced and percent of ight delays blamed on the airline to determine if these concerns are justified. This was done, and data from 2005 and 2006 appeared to justify the concerns of the critics. Do more recent data still support the concerns of the critics? Here are data from 2009:3 '9 AIRLINES Outsource Delay - Outsource Delay Airline percent percent Airline percent percent AirTran 52.8 24.21 Hawaiian 74.1 7.94 Alaska 56.8 17.09 JetBlue 53.7 22.55 American 23 .3 22.71 Northwest 59.8 20.85 Continental 44.5 21.23 Southwest 61.7 1700 Delta 25 .6 21.44 United 40.6 19.02 Frontier 26.8 21.70 US Airways 60.4 19.13 4.7 Outsourcing by airlines. Does your plot for Exercise 4.5 show a positive, nega tive, or no association between maintenance outsourcing and delays caused by the airline? One airline is a low outlier in delay percent. Which airline is this? Aside from the outlier, does the plot show a roughly linear form? If it does, is the relation ship very strong? '3 AIRLINES
Step by Step Solution
There are 3 Steps involved in it

Get step-by-step solutions from verified subject matter experts