

Question: From the following Aggregate Planning graph below, identify which curve is a ZIP and a CWP a. Lower Yellow curve = ? b. Middle
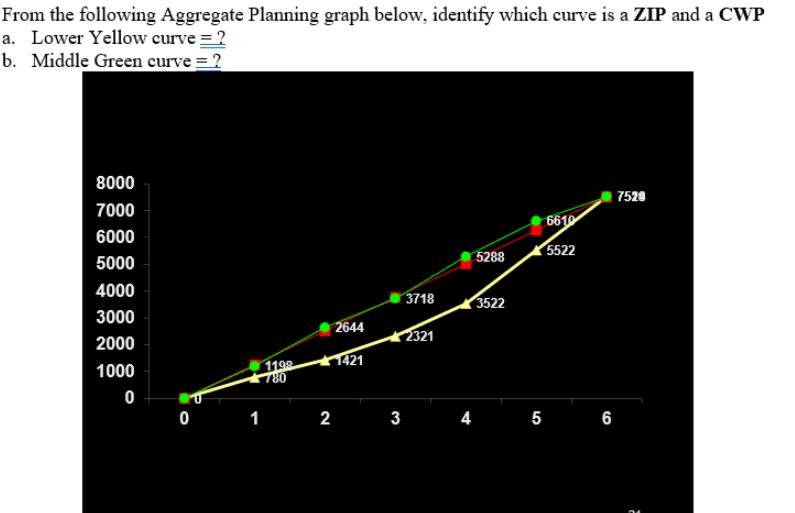
From the following Aggregate Planning graph below, identify which curve is a ZIP and a CWP a. Lower Yellow curve = ? b. Middle Green curve = ? 8000 7000 6000 5000 4000 3000 2000 1000 0 0 1198 780 2644 1421 1 2 3 3718 2321 5288 3522 6610 5522 7529 4 5 6
Step by Step Solution
There are 3 Steps involved in it
1 Expert Approved Answer
Step: 1 Unlock

The image youve provided shows an Aggregate Planning graph with three distinct curves but without an... View full answer
Question Has Been Solved by an Expert!
Get step-by-step solutions from verified subject matter experts
Step: 2 Unlock
Step: 3 Unlock