

Question: 4.1 . Match the linear correlation coefficient to the scatter diagram. The scales on the x- and y-axes are the same for each diagram. Print
4.1
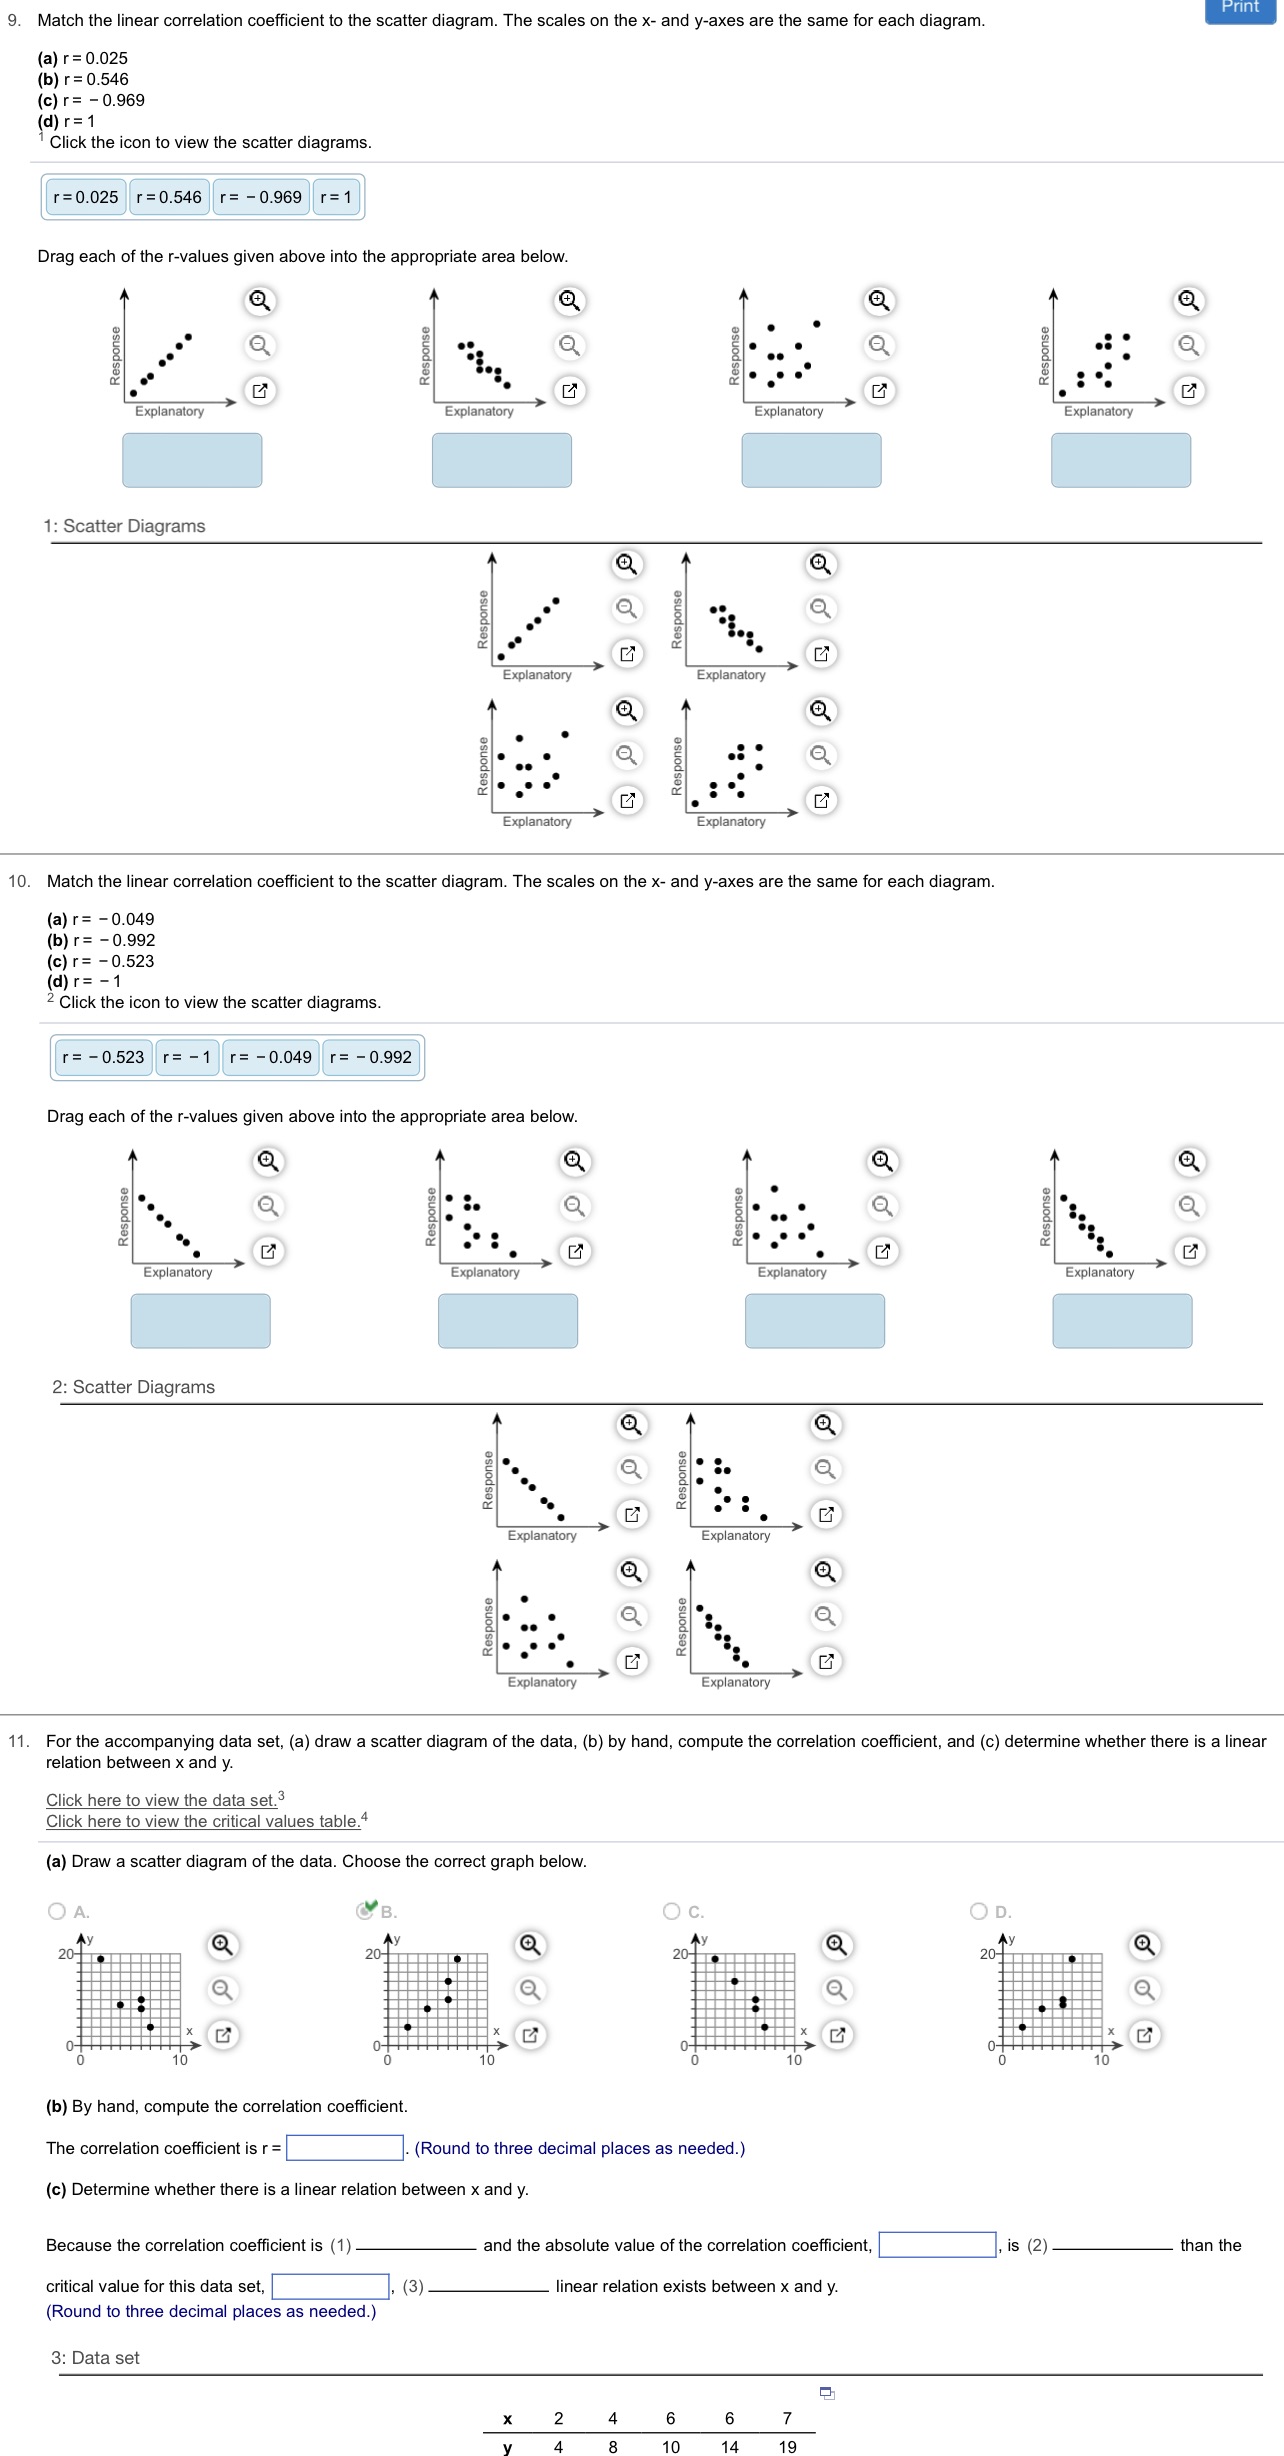
. Match the linear correlation coefficient to the scatter diagram. The scales on the x- and y-axes are the same for each diagram. Print (a)r= 0.025 (b) r = 0.546 c) r= - 0.969 d) r= 1 Click the icon to view the scatter diagrams. r= 0.025 r=0.546 r= - 0.969 r= 1 Drag each of the r-values given above into the appropriate area below. O Response Response Response Response Explanatory Explanatory Explanatory Explanatory 1: Scatter Diagrams Response .. . . Response ... .. Explanatory Explanatory Response Response Explanatory Explanatory 10. Match the linear correlation coefficient to the scatter diagram. The scales on the x- and y-axes are the same for each diagram. (a) r= - 0.049 (b) r= - 0.992 (c) r= - 0.523 (d) r= - 1 Click the icon to view the scatter diagrams. r= - 0.523 r= -1 r= - 0.049 r= - 0.992 Drag each of the r-values given above into the appropriate area below. O Response Response . .. .. Response Response .. . Explanatory Explanatory Explanatory Explanatory 2: Scatter Diagrams Response Response . .. .. Explanatory Explanatory Response Response ..'.'. . Explanatory Explanatory 11. For the accompanying data set, (a) draw a scatter diagram of the data, (b) by hand, compute the correlation coefficient, and (c) determine whether there is a linear relation between x and y. Click here to view the data set.3 Click here to view the critical values table. (a) Draw a scatter diagram of the data. Choose the correct graph below. O A. B. O C. OD. Q Ay 20- 20- 20- 20- (b) By hand, compute the correlation coefficient. The correlation coefficient is r = (Round to three decimal places as needed.) (c) Determine whether there is a linear relation between x and y. Because the correlation coefficient is (1) and the absolute value of the correlation coefficient, , is (2) than the critical value for this data set, . (3) linear relation exists between x and y. (Round to three decimal places as needed.) 3: Data set 2 6 6
Step by Step Solution
There are 3 Steps involved in it

Get step-by-step solutions from verified subject matter experts