

Question: 4.14 Using the data shown in Figure 4.5, find the best values of s and t, in the Casson equation that fit these data. Recall
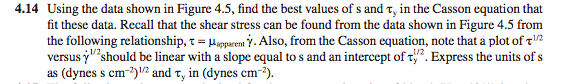
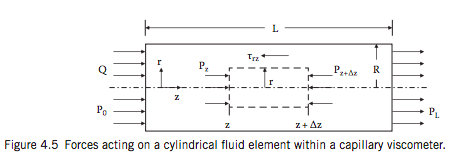
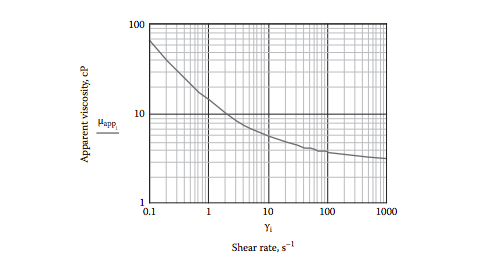
4.14 Using the data shown in Figure 4.5, find the best values of s and t, in the Casson equation that fit these data. Recall that the shear stress can be found from the data shown in Figure 4.5 from the following relationship, t = Happacem Y. Also, from the Casson equation, note that a plot of 12 versus y?should be linear with a slope equal to s and an intercept of +2 Express the units of s as (dynes s cm-212 and ty in (dynes cm-2). L Trz P, Pc02 R z Po Z z+Az Figure 4.5 Forces acting on a cylindrical fluid element within a capillary viscometer. 100 Apparent viscosity, CP 10 Happ 1 0.1 1 100 1000 10 Y Shear rate, s-1
Step by Step Solution
There are 3 Steps involved in it
1 Expert Approved Answer
Step: 1 Unlock

Question Has Been Solved by an Expert!
Get step-by-step solutions from verified subject matter experts
Step: 2 Unlock
Step: 3 Unlock